State of the Chase Season 2021

Status
Not open for further replies.
Well, happy spring everyone! It being the start of traditional chase season I feel confident enough to lock in a forecast.

Forecast 20201 Tornado Season (MAMJ) :

Counts: Average (754 tornadoes across the CONUS during spring, 1250 plus or minus 50 for the year)
I feel fairly confident on average numbers for the chase season and year. With a moderate La Nina, but complicating factors such as drought, I think we see pretty normal activity. This activity should pick up fairly quickly here over the next two weeks with the first hints of the spring pattern shaping up. Some killers for this would be an early northward retreat of the jet (Aka Death Ridge) cutting into numbers early. This is a distinct possibility given the ongoing drought. A second, perhaps better for us failure mode would be a weak resurgent la nina. This could throw out some higher tornado numbers, though I think this is less likely. Its about 50/50 which side of the coin we end up on, which means I'm going to hedge to average.

Outbreak Days (10+ Tornadoes within 6 hours): Above Average
Its an emerging trend, fewer tornado days, but more tornadoes per day. Im sticking with that. You can define outbreaks in many ways so I'll have to run some stats to verify, but I think we see a more active outbreak pattern going into April and a few very big count days. The forecast is also calling for an above-normal hurricane year. I think we see another active TC tornado year this summer and fall.

Number of EF2+ tornadoes:
Well Above Average (Greater than 1 STD above the normal mean)
Im taking a bit of a risk on this one but, with the southeast and eastern half (more populated) of tornado Alley looking more favorable, I'm leaning towards a much higher count of sig tors for the simple fact I expect more of them to hit things. The same trend will probably hold for fatalities.

Chasabillity Score: Average 6/10

My completely scientific and no non-sense chasing index, just kidding it's entirely arbitrary. Not a great year, not a bad year, somewhere right in the middle with a bit more chasing potential. We probably won't be chasing west of I-35 as much as we would like putting a dent into the chaseabillity of some systems, but the average counts combined with a few bigger days will get peoples chasing counts up. Midwestern gang and the southeast should have a decent year. Southern and central plains also won't have much to complain about. Perhaps not the best for the front range and Texas Panhandle guys and gals but a few days spark off. A banner year for a few, but sufficient for most.

We will see where we go from here. Good luck to everyone, stay safe and happy hunting!
 
On the S2S front, Victor is amped up about the prospects for overall CONUS activity through the month:
And on the seasonal front, I thought it was worth following up on my January post regarding ENSO: thankfully, Nina conditions have not yet begun to fade off. In fact, Nino 3.4 mean SSTAs this week are still -1.2 C, which is near the baseline they've oscillated around ever since November. This nudges the ENSO trajectory a bit more toward the "true Nina" years of 1999, 2000, 2008, or 2011, and slightly further from the very borderline cases of 2006 and 2018 -- in particular because the western equatorial Pacific is still cold, whereas it was already near normal in those years. Really, though, we're sitting firmly between those two clusters of recent ENSO values, with the closest historical comparisons (strictly in terms of Nino 3.4) being 1985 or 1971. Most ENSO guidance still suggests we'll reach the neutral threshold (-0.5 C) by AMJ, which would be quite different from 1999 or 2008, but the spring barrier is obviously at play here. Overall, though, I'll take it as a small win that we haven't yet seen sustained warming and keep drifting from the unmentionables of 2006 and 2018.
 
Yes Dr. Gensini might have put it into words better than me, at least more succinctly. La Nina (3.4) is still cool not warming yet.

Gasoline was $2.32 yesterday, of course right after my post; so yes, spring creep has begun. It's because Refineries shift blends and/or mix of refining Diesel, gasoline and heating fuel. They're not gouging chasers, haha, but other spring travel demand overlaps the above.

Back to the forecast, yes the next couple low press systems are Deep South and will scour the Gulf Coast a bit. However they are not full latitude phased beasts at all - more detached; so, the moisture is just tempo held.

Mid-month, perhaps convenient with the time change, more southwest flow gets established. Few models have a less warm outcome and MJO interference; however, it's mostly trough West/Rockies and SER. That could get mid-March going Dixie or Hoosier Alleys.
 
I feel fairly confident on average numbers for the chase season and year. With a moderate La Nina, but complicating factors such as drought, I think we see pretty normal activity. This activity should pick up fairly quickly here over the next two weeks with the first hints of the spring pattern shaping up. Some killers for this would be an early northward retreat of the jet (Aka Death Ridge) cutting into numbers early. This is a distinct possibility given the ongoing drought. A second, perhaps better for us failure mode would be a weak resurgent la nina. This could throw out some higher tornado numbers, though I think this is less likely. Its about 50/50 which side of the coin we end up on, which means I'm going to hedge to average.

Just a question for my own continuing education - isn‘t the position of the jet independent of drought conditions? I understand the unfavorable impact of drought conditions, but didn’t think it could actually affect the synoptic jet configuration?
 
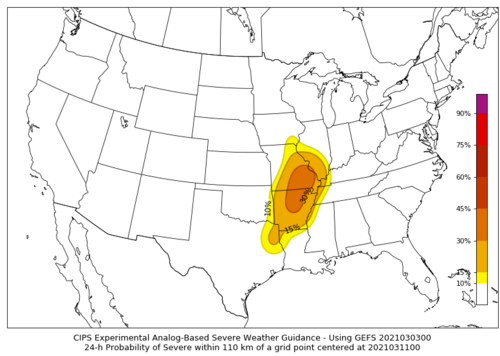
I did look at the CIPS analogs for day 8, and it did show this. 1614778712784.png
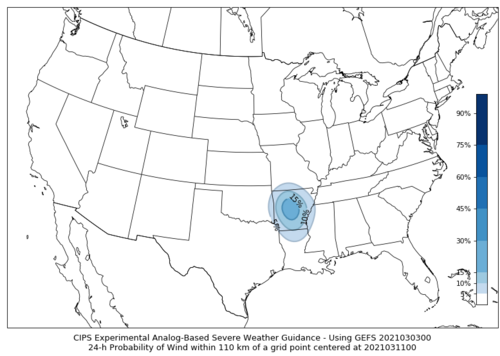
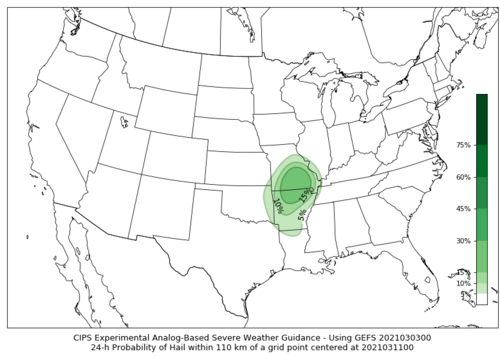
I don't know if this should be taken as face value, but it only has the probabilities of wind and hail separately, which does tell me that it may not even be a tornado threat, but rather primarily a damaging wind threat.

1614778855949.png

Above is the wind probability, and the image below is the hail probability.
1614778908005.png
 
Just a question for my own continuing education - isn‘t the position of the jet independent of drought conditions? I understand the unfavorable impact of drought conditions, but didn’t think it could actually affect the synoptic jet configuration?

With how interconnected everything is its tough to say things like jet position are truly independent from this or that. Drought likely plays some role in the position of the mid-level jet given that synoptically it's driven by anomalous large-scale descent or lack of ascent. There's also the chicken vs egg argument where an anomalous condition can result in feedback to modify the larger pattern. Ie, warmer and drier conditions can result in greater sensible heat flux increasing mid-level heights prolonging a drought.

My wording is a tad confusing, I was going more for showing the link to early-onset ridging from early decaying La Ninas and how that in combination with western US drought can cut into storm chances. Early decay La Ninas can result in a rapid northward retreat of the jet across the CONUS. Couple that with a stronger EML from elevated temps and drought across the Rockies you have a scenario where you have weaker than average forcing for ascent working against warmer than average mid-level temps.
 
Just a question for my own continuing education - isn‘t the position of the jet independent of drought conditions? I understand the unfavorable impact of drought conditions, but didn’t think it could actually affect the synoptic jet configuration?

Oh, it absolutely can. Keep in mind that tropospheric jets usually delineate a large-scale horizontal temperature gradient (integrated vertically over the remainder of the troposphere). A drought can help cause a heat dome to form which would amplify heights over the top of the dome. This could either cause the hemispheric temperature gradient to shift north, or just weaken it altogether. Thus the jet could either shift north or weaken.

Then again, a weakened jet has a tendency to get all squiggly/dippy/dodgey/ducky/divey/...and...dodgey...and thus could potentially result in more shortwaves and overall...more events.

(Bonus points to anyone who gets the reference)
 
Last edited:
Oh, it absolutely can. Keep in mind that tropospheric jets usually delineate a large-scale horizontal temperature gradient (integrated over the remainder of the troposphere). A drought can help cause a heat dome to form which would amplify heights over the top of the dome. This could either cause the hemispheric temperature gradient to shift north, or just weaken it altogether. Thus the jet could either shift north or weaken.

Then again, a weakened jet has a tendency to get all squiggly/dippy/dodgey/ducky/divey/...and...dodgey...and thus could potentially result in more shortwaves and overall...more events.

(Bonus points to anyone who gets the reference)

Dodgeball? If you can dodge a Tennis ball sized hail stone you can dodge a ball.
 
Oh, it absolutely can. Keep in mind that tropospheric jets usually delineate a large-scale horizontal temperature gradient (integrated vertically over the remainder of the troposphere). A drought can help cause a heat dome to form which would amplify heights over the top of the dome. This could either cause the hemispheric temperature gradient to shift north, or just weaken it altogether. Thus the jet could either shift north or weaken.

Then again, a weakened jet has a tendency to get all squiggly/dippy/dodgey/ducky/divey/...and...dodgey...and thus could potentially result in more shortwaves and overall...more events.

(Bonus points to anyone who gets the reference)
Jeff makes a really good point using a thermal wind argument here that I didnt consider. But there is a fair amount of evidence that droughts and even anomalously wet periods can influence the large-scale synoptic regime. James, I hope that answered your question a bit!
 
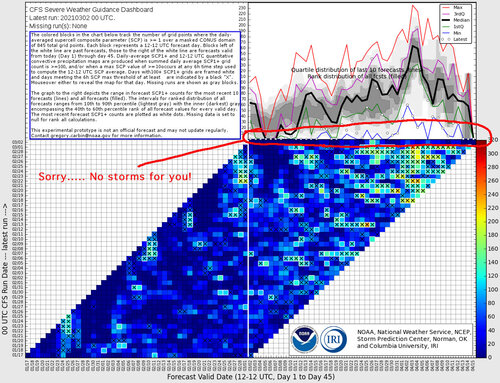
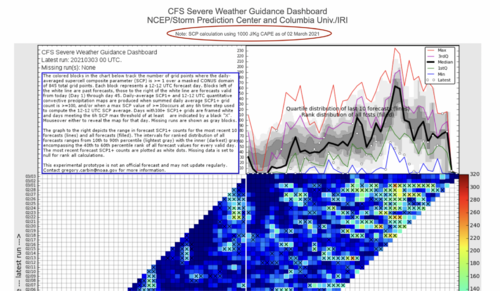
@Warren Faidley The 3/3/21 CFS dashboard doesn't look any better than the 3/2/21 one you posted and tweeted about. I was kind of kidding when I replied to your tweet about that if 2021 was anything like 2020 then the 3/3 run would be the one to verify, but if this trend continues the first half of spring could be really slow.
 
@Warren Faidley The 3/3/21 CFS dashboard doesn't look any better than the 3/2/21 one you posted and tweeted about. I was kind of kidding when I replied to your tweet about that if 2021 was anything like 2020 then the 3/3 run would be the one to verify, but if this trend continues the first half of spring could be really slow.

Reminder about the dashboard, they switched from calculating Supercell Composite at 500 J/kg of MUCAPE to 1000 J/kg on March 2 as a rough proxy for the change from cold to warm-season thermodynamics. That's the drop off that we are seeing. Its still progging the same environments, but the grid point counts are lower due to the higher CAPE constraint. Another reminder about the dashboard, beyond day 10 its essentially useless compared to climatology. View it with caution.
 

Attachments

  • Screen Shot 2021-03-03 at 2.37.22 PM.png
    Screen Shot 2021-03-03 at 2.37.22 PM.png
    1.7 MB · Views: 0
Thanks @adlyons I had forgotten about that. I always treat the dashboard with a grain of salt. I mainly use it to see if I might have missed something in my analysis and need to go back and take a second look.
 
I am no longer connected to AccuWeather. With that stipulated, I don't like anyone's >30day outlooks. No consistent skill has been demonstrated.

But, if you are going to criticize AW, what about the NWS making specific daily forecasts of severe weather? https://www.spc.noaa.gov/exper/CFS_Dashboard/n Shouldn't you also criticize them?


Off-topic, but I see AccuWeather's seasonal forecasts as akin to throwing shit against the wall and seeing what sticks.

I don't think there's any reliable way to predict activity level of the spring tornado season beyond aggregate statistics, but we're heading into spring with massive drought in the southwest (although, parts of NW TX, W OK, and W KS have escaped the bad stuff), so that can't be great. Could be looking at strong caps.

Worst part is the synoptic pattern, though. That's what hosed 2018 and 2020. I don't see how that can be predicted at this length.
 
Status
Not open for further replies.
Back
Top