• A friendly and periodic reminder of the rules we use for fostering high SNR and quality conversation and interaction at Stormtrack: Forum rules

    P.S. - Nothing specific happened to prompt this message! No one is in trouble, there are no flame wars in effect, nor any inappropriate conversation ongoing. This is being posted sitewide as a casual refresher.

State of the Chase Season 2024

Hey everyone,

I hope you had a great holiday season and new year. I figured I'd get the ball rolling with a new 2024 thread. How was your chase season? What do you hope this year brings? Any big plans or predictions for 2024?


Now on to the seasonal forecasting stuff.
I am reshowing some of the verification work that I had presented in the previous thread from the 2023 forecast. Storm Data 2023 won't be ready until February or March, so I am using some of the preliminary data SPC sent in for the tornado counts. I won't rehash the entire thread from 2023, but the quick summary is as follows;

2023 Summary:

So, some big takeaways:

  • I expect an above-average chase year with above-average numbers of tornadoes, especially early. Combined with an average back half our numbers should be up.
  • Several early-season events may produce a lot of tornadoes from the Mid South through the Midwest and eastern Plains. I would prepare to chase a bit earlier than average and be situationally aggressive. Positive TNI values favor increased vertical shear and moisture advection across the central US.
  • I expect an average Plains year for the second half of Spring. This is the most uncertain part of the forecast and is conditional upon the ENSO and general flow state behaving. We should see some drought improvement.
  • Things that can still go wrong:
    • Northwest Flow over the central US mid to late Spring.
    • Enhanced risk of Blue Sky Busts on the dryline late this Spring from a warm EML out west.
    • ENSO misbehaves and keeps us locked in neutral conditions and weaker background flow. With the Spring predictability barrier still up, it's possible we don't switch and just keep neutral. That could go either way but generally favors lower tornado counts.

Takeaways from 2023:
  • As forecast, La Nina decayed early leading to largely ENSO-neutral conditions for Spring. However, El Nino took hold late and grew in strength quickly.
  • The forecast called for an active early season (March and April) with a near-normal May. Early starts have been the theme for the last several years with March having 4 above-average years.
  • March and the first half of April did meet this with several large outbreaks over the Midwest. But, a very unfavorable pattern developed toward the end of April and into early May.
  • Late May, once again, failed to materialize. Outside of a few days mid-month, and a week of storms in New Mexico, very little occurred inside traditional chase alley across the southern and central Plains.
  • June showed up in a big way. I don't have the preliminary data yet but a several weeks-long severe weather outbreak occurred from the Plains into the Southeast with tornadoes, hail and damaging winds.

MonthTornado Count1992-2022 AvgForecastResult
March20691Above AverageHit
April147184AverageMiss
May172270AverageMiss
MAM Total:525545Above Average (775)Miss

2023_MAM_STD_ANOM.png
2023tor (1).png
torgraph-big.png


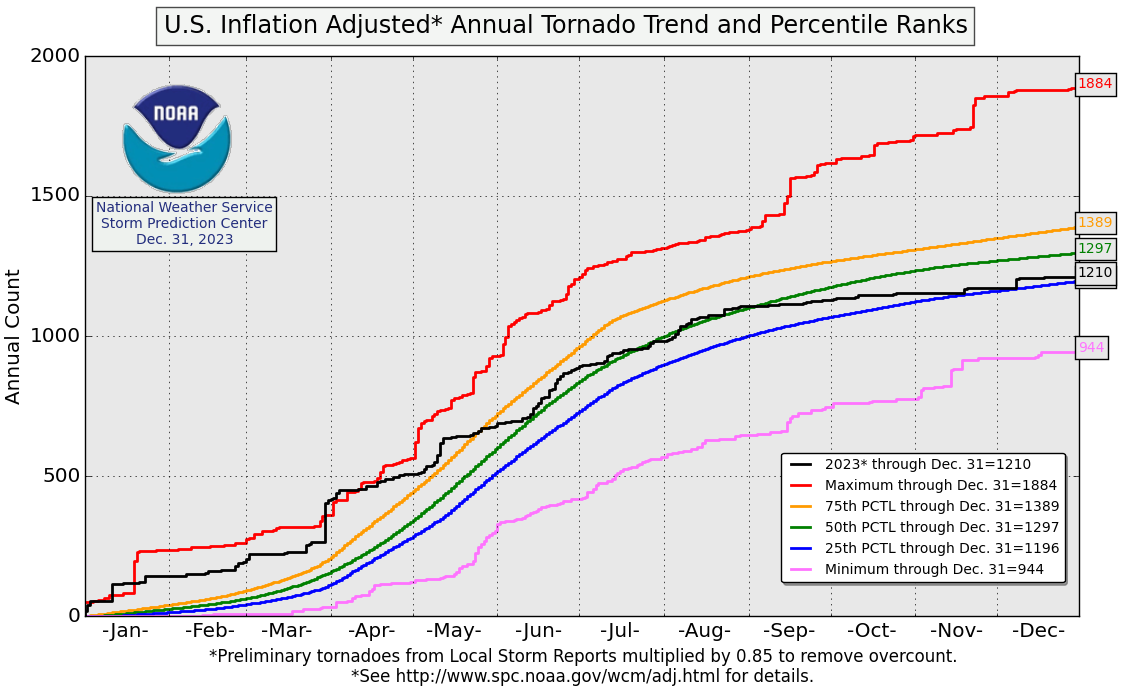
Graphically, the story is quite telling. A very early start to the year with tornado counts in the +75th percentile, and even briefly exceeding the maximum, kept rolling right into early Spring, but then fell off quickly. Using the inflation-adjusted LSR trends, parts of April and May were very flat. The Fall season was also very quiet. Spatially the story is even more obvious. Nearly the entire central US has significant negative anomalies. On the flipside, the Midwest and parts of the South did see a big area of positive anomalies in the 2-4 STD range. The maximum in z-score (standardized anomaly) was actually over OKC with a value of nearly 6. Two tornado events occurred there during the year. This shows the power that just a couple of events can have in changing the statistical outcomes for small areas. With that in mind, I have some planned changes for my 2024 forecast to look more objectively at the spatial anomalies. More on that below.

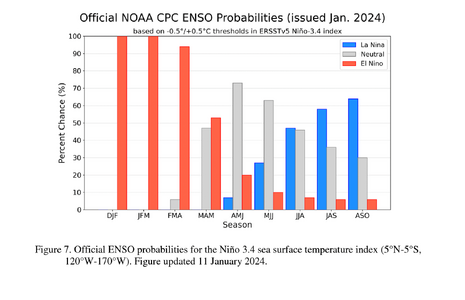
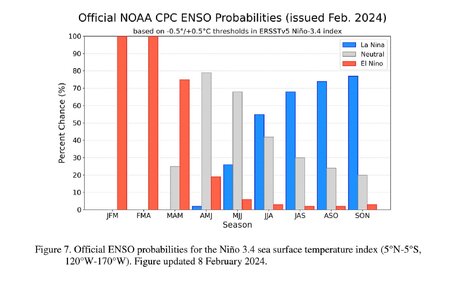
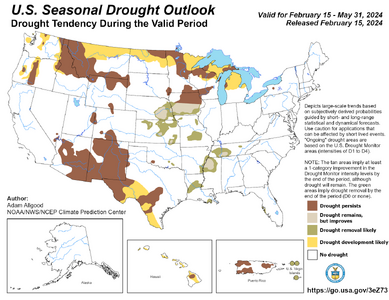
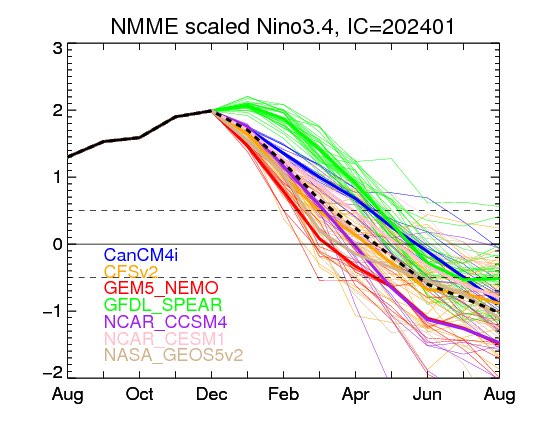
For 2024, things are still a bit murky and I haven't had a ton of time to sit down and come up with an explicit forecast yet. I have some vague ideas, which I'll share here, and hopefully, I will have a full write-up later this month, or into early Feb. The biggest thing that has been apparent so far is that El Nino is on its way out, quickly. The updated ENSO forecasts from CPC show Nino has peaked and is already entering a rapid decay process in the eastern Pacific. Recent GEFS data is also suggesting significant strengthening of zonal winds which would favor coastal upwelling and the emergence of negative SST anoms. This will likely favor a rapid decay with Neutral to even weak La Nina conditions possible by mid to late Spring. Meanwhile, the Gulf of Mexico remains quite warm and should continue to be so through the spring according to several of the coupled climate models.
image0.jpg

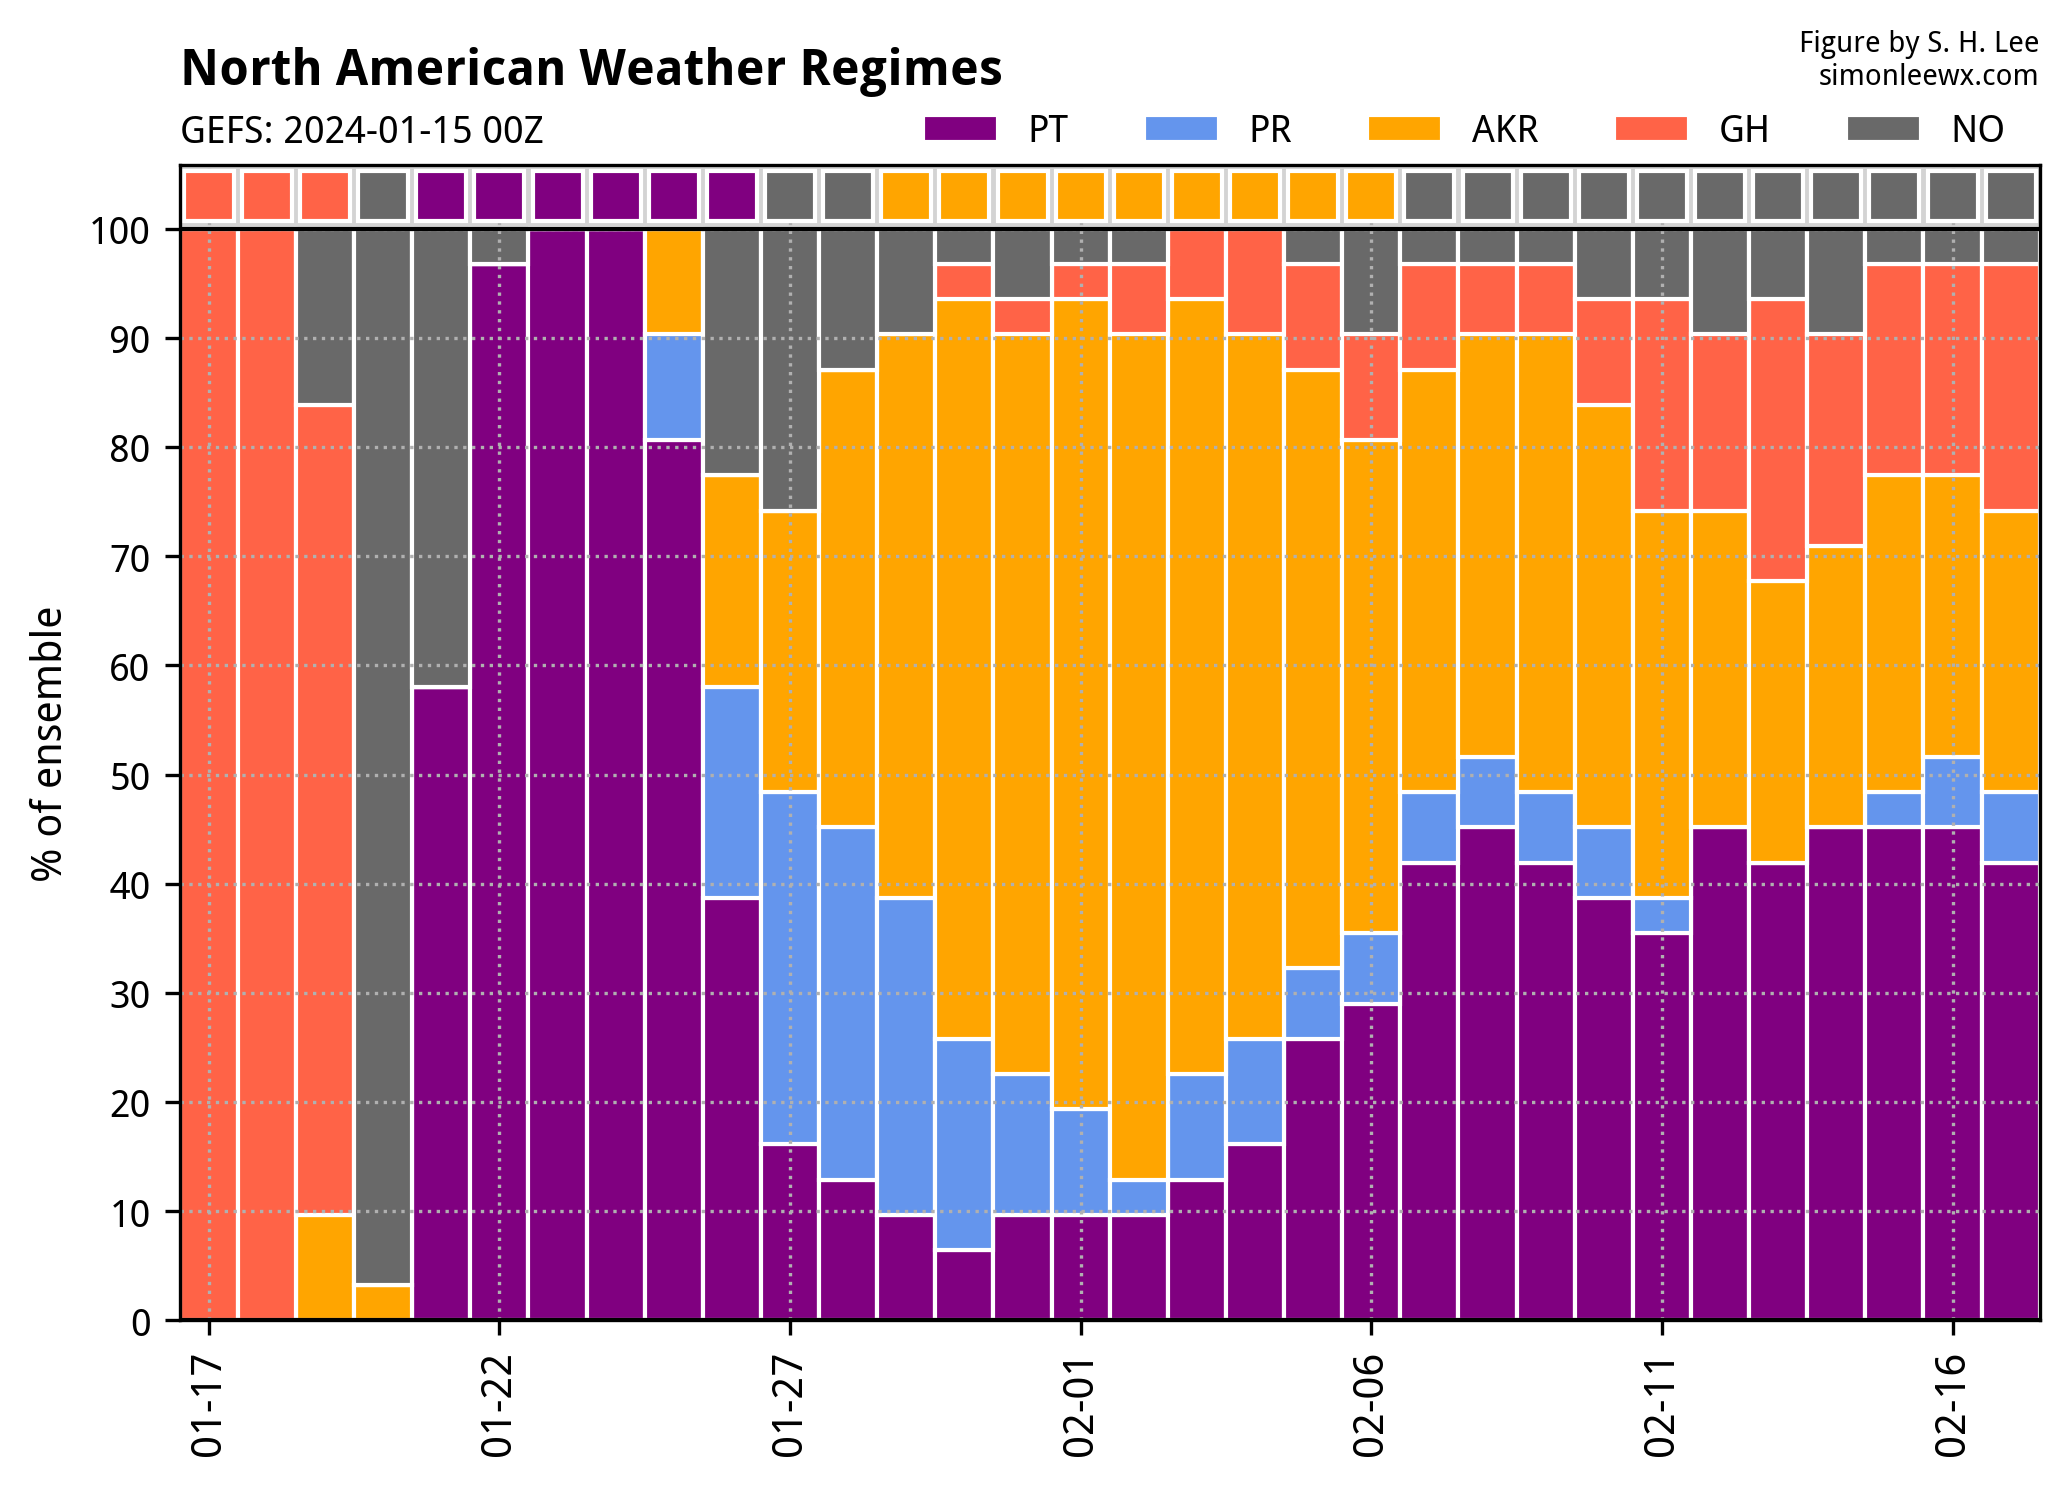
So, with EL Nino on the way out, what sort of pattern can we expect? Again, the details are still a little fuzzy and it will likely be dependent on how ENSO transitions. We have been in quite an active storm track as of late but, displaced much farther south than usual. This is a classic strong El Nino signal with a southerly displaced jetstream. That appears likely to continue with longer-range GEFS/EPS and Weekly ECMWF/CFS data suggesting the possibility of additional cold air outbreaks over the central and eastern US toward the end of Jan and into Feb. (Read about S.H.LEE's work here)
regimes_gefs_20240115.png


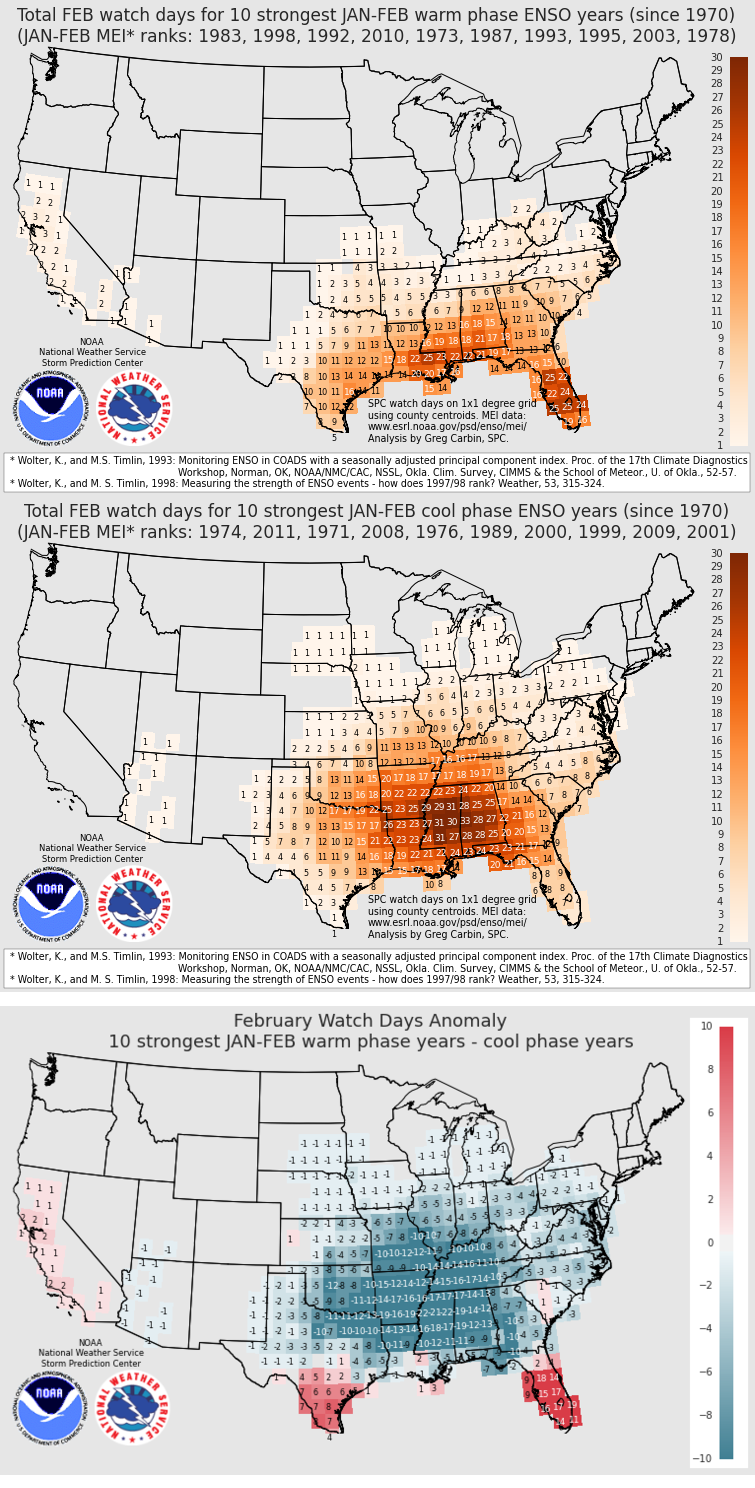
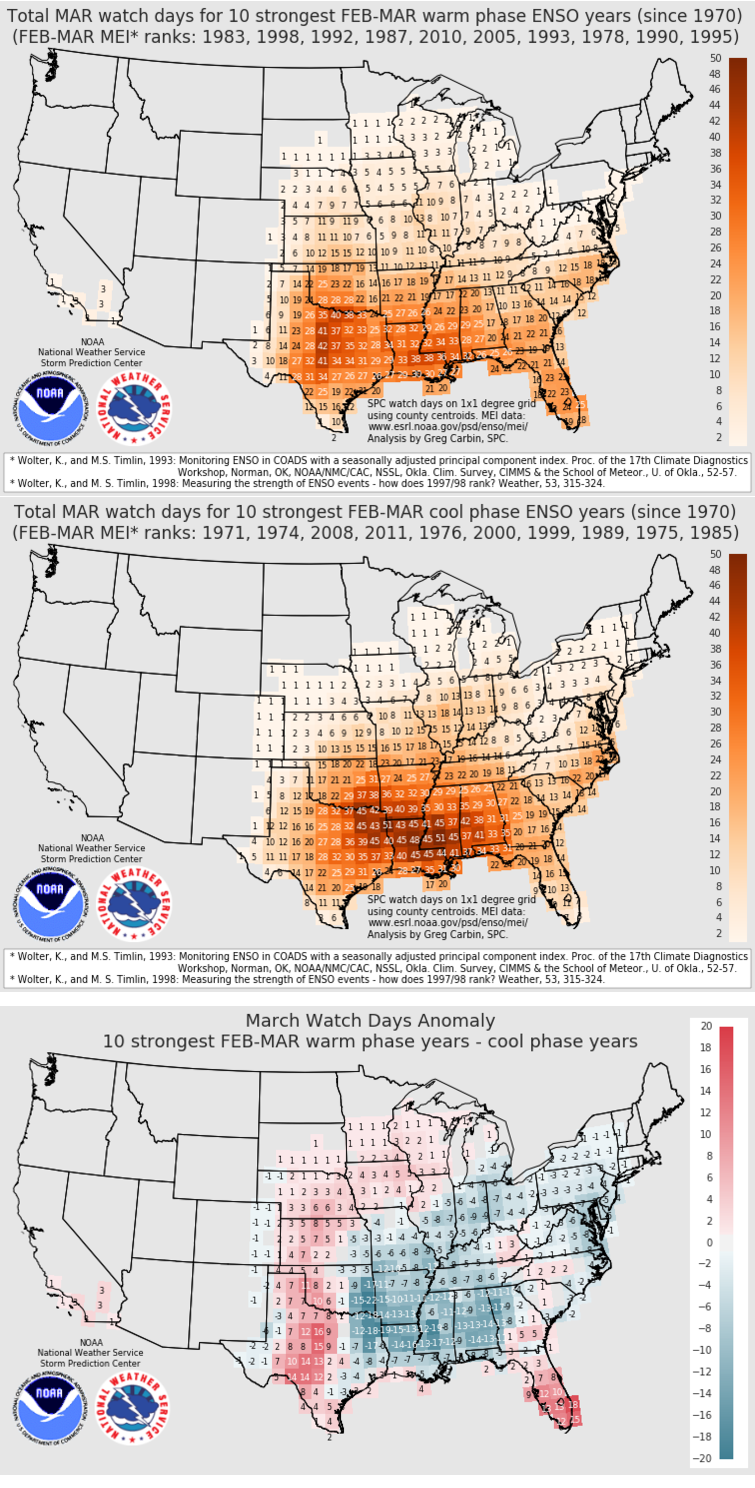
With significant cold air intrusions and an active southerly displaced jet, this year looks to be starting much differently than the previous. I do not expect much in the way of severe weather activity through the remainder of Jan into Feb. This pattern could continue into March with cold air locked over parts of the northeastern/central US suppressing inland moisture return and limiting the potential for severe storms/tornadoes. While a few severe days are certainly still possible with an active Jet and pattern, they look most likely to be displaced south over Southeast Texas, the far southern Gulf Coast, southern Carolinas, and Florida in typical strong El Nino fashion. Looking at some work by past SPC forecasters, watch anomalies are quite apparent over the Mid South and southern Plains in El Nino years through the winter and early Spring. There's some recovery in March across the Texas Panhandle and High Plains though which could be a good sign for chasers. But, the gist of this is that this may be a slower start without much severe weather early in the year. This is likely due to the tendency for EL Nino to displace the jet stream farther south during the winter and more persistent ridging over the central US. With cold air over the CONUS, It takes considerable time for the jet to lift north and allow moisture to return inland. This shifts for favorable patterns toward the back half of the season, sometimes.

feb.png

mar.png


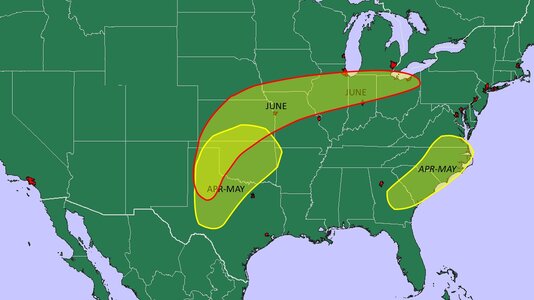
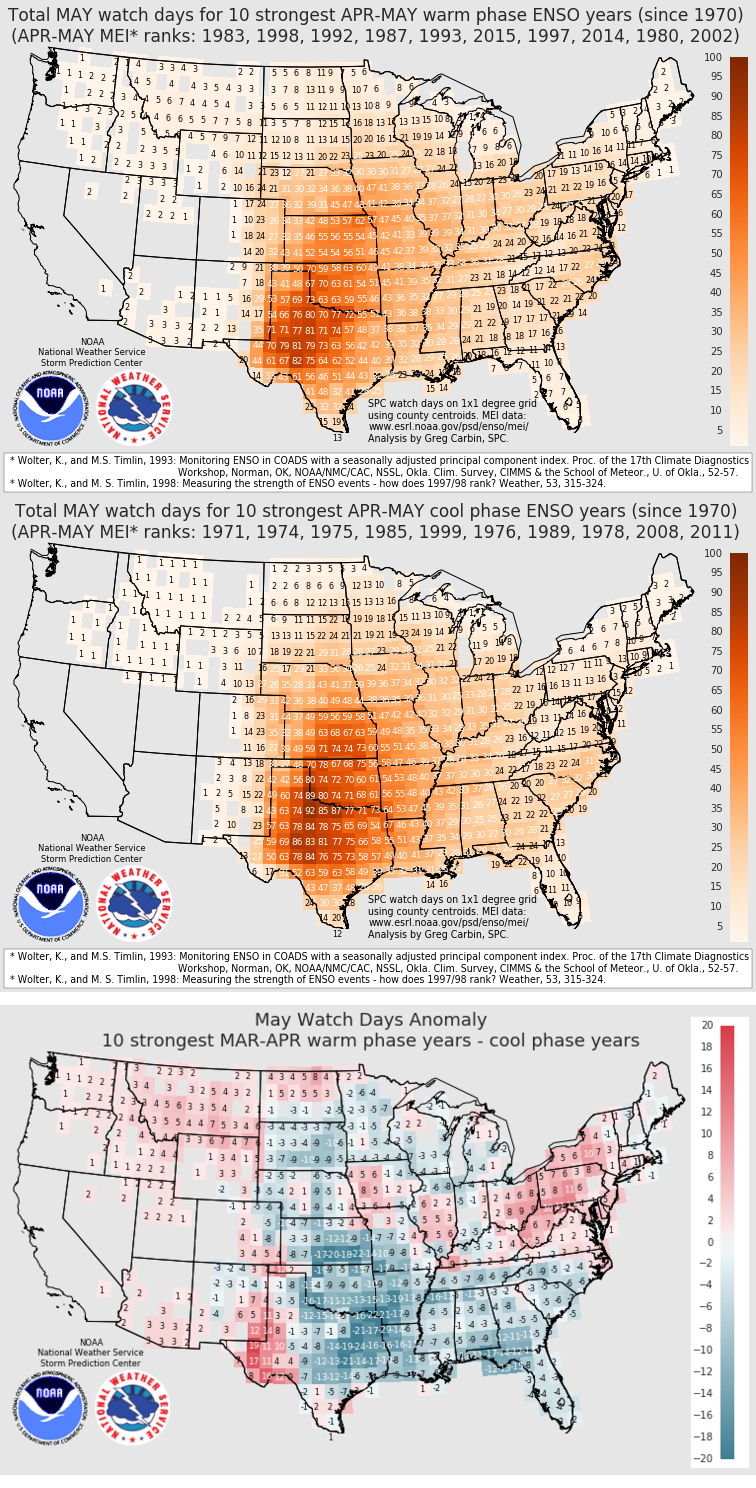
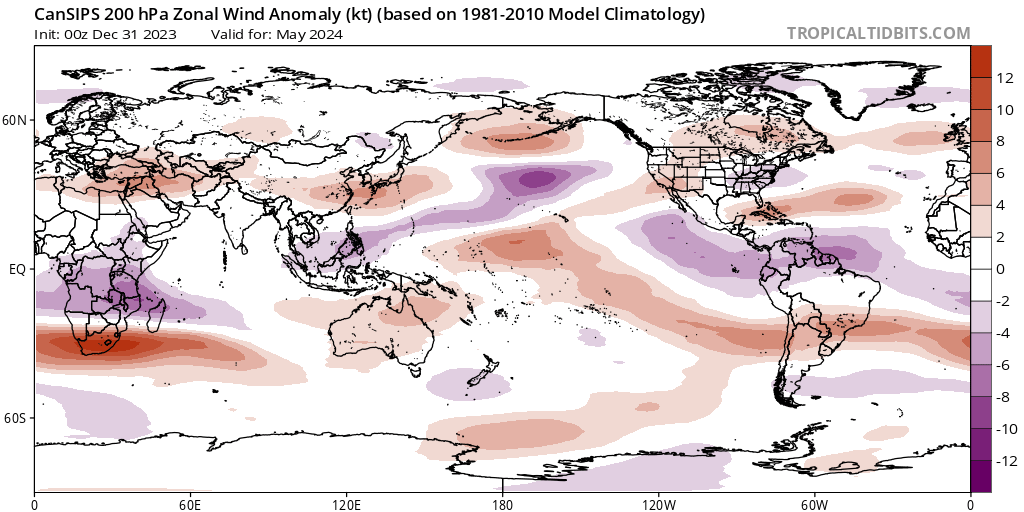
Now as we get later into typical El Nino Years, things look a little different. After slow starts, May is usually average to slightly above average with strong Nino year tornado counts. There are positive anomalies over the High Plains and parts of the Midwest/Ohio Valley. There are still negative anomalies over parts of the southern and central Plains, but they are skewed eastward. This also doesn't account for early termination of strong Ninos which is what we are expecting this year. Recent research from Dr. Sang Kim Lee (Below: Sang-Ki Lee et al 2016 Environ. Res. Lett. 11 044008 figures B and F) indicates a statistically significant chance greater than 40% for tornadoes and outbreak days across the Plains and Midwest during May when El Nino terminates early. While there isn't a ton of data out there about this specific scenario, some of the climate models do show a similar pattern (CANSIPS 200 mb zonal wind) to Dr. S K Lee's work indicating some enhanced westerly flow over the southwestern US and above-average surface pressure over the southeast from late April through May. This coincides with some positive precipitation anomalies over the Plains. This could support some better chasing in the later part of the season across the Plains.


may.png
erlaa1ca0f2_lr.jpg


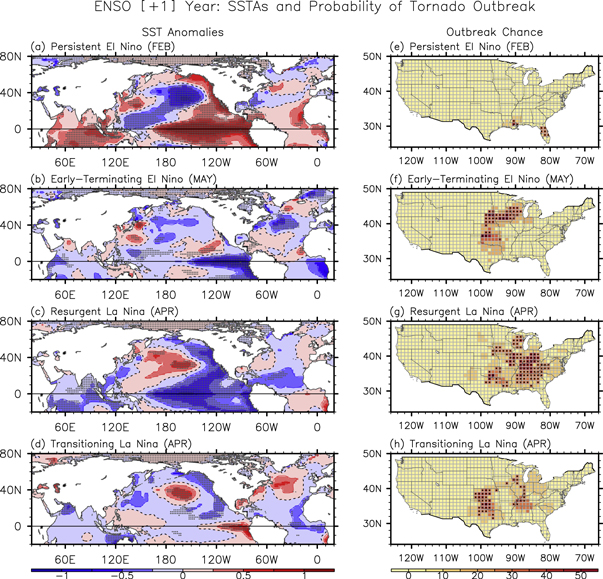
Environmental Research Letters, Volume 11, Number 4
Citation Sang-Ki Lee et al 2016 Environ. Res. Lett. 11 044008
DOI 10.1088/1748-9326/11/4/044008

cansips_u200a_global_5.png


So for a preview of the 2024 chasing forecast:
  • The winter and early Spring season looks to be quiet over the typical Dixie Alley areas. More activity than usual may be possible over parts of the far southern Gulf Coast, southeast Texas, the Carolinas and Florida. However, cold air intrusions may continue to suppress severe chances through the remainder of winter.
  • March and April look slower than the past few years. I think the streak of above-average March tornadoes comes to an end this year.
  • Traditional chase season has a chance to be a bit better than the last few years. A quickly decaying Nino into neutral may allow for some more active chasing into May.
  • Total numbers for MAM will probably be below average but May should be near or slightly above average.


NEW STUFF!

Finally, in addition to the seasonal tornado number forecasting I've been doing since 2020, I've been looking at ways to be more objective in my spatial forecasting. instead of the generic maps with "above average, below average etc..." I took some time and developed a web tool that I can geo-reference specific forecast info. For example, I can draw a polygon and assign a value to it like the graphic below. I can then take that geojson and overly it on the same grid I used to make the tornado anomaly maps from above. By doing this I can objectively assign each grid box a forecast value and a verification value. I can then compare my forecast to the verification objectively instead of the eye test I have been using. I plan to make a map for March/April/May in the upcoming forecast and periodically update them as the season goes on. Using some simple metrics I'm hopeful that I can show some forecast skill for tornado anomalies at lead times of several months.
Untitled presentation.png
Untitled presentation (1).png
(Example 2024 forecast graphic. My best guess for the remainder of Winter and into early Spring.)

Things I hope to add for the 2024 forecast:
  • Significant (EF/F-2+) tornado anomaly and count forecasts by month.
  • Objective spatial standardized anomaly forecast.
  • Objective spatial verification of anomaly forecasts.
  • A public website to view running forecasts and verification (TBD)

That's enough rambling from me.
 
Brilliant as always Adlyons, this was great information and definitely appreciate you putting it together. I like the spatial component you're adding in as well.

-Question on the boxiness of the polygons, was that by design to better fit into some specific statistical guidance later on? or could you alter the style to where its more 'heat or gravitational' to the probabilities you are expecting? - - just curious

The boxiness is two fold. On the drawing map, it was just me quickly outlining the area for demonstration purposes. I will be trying to smooth those out in the actual forecasts coming up. On the gridded plot its because the gird is 40x 40 km. Anytime the polygon intersects the grid box I just set the whole box to "on" (giving it a value of 1 or -1). I plan to smooth out those plots so it's not as "sawtoothy" and should look more like the polygons. It shouldn't be a factor in the actual forecast verification since I'll just be counting which grid boxes got set to on and comparing them with the observed grids above and below a certain threshold.
 
I don't know why it didn't dawn on me about the grids. because why would anyone naturally draw boxes like that on their own hahaha. (facepalm)
 
Just checking back in with a quick update. Yesterday was Groundhog's Day and that seems as good a time as any to see how things are looking for the next few weeks. Everyone's favorite prognosticating rodent, Punxsutawney Phil, called for an early Spring this year. I have my doubts about that. The latest forecast guidance shows a potentially significant weakening of the upper-level polar vortex over Northern Europe and the US in the coming weeks. That usually corresponds to high-amplitude and high-latitude blocking over the poles. This is a similar, but much stronger signal evolution of the cold air outbreak that we had for the second half of January. 1706970450247.png

While it's not certain if the wind reversal at 10 hpa will occur (to officially give us a stratospheric warming event), it does appear very likely that another surge of colder air will move into the eastern and central US later this month into early/Mid March. This may not be a cold air outbreak on the same level as January given the time of year (ie maybe not as cold ), but cooler-than-average temperatures are very likely. This should also suppress inland moisture return and convective potential for the next several weeks.
1706970952482.png

The good news however is that the southerly displaced jet will continue to remain very active and widespread preciptiation over the Plains should continue to ease the previous drought. Much of the high plains are experiencing a top 5 wettest Winter on record which has been tremendously helpful. I see no signs of that pattern easing with the potential for precipitation to remain above average through the next several weeks.

1706973996868.png

Finally, I am waiting on the last run of the monthly CFS NMME and Euro models and will post the first round of forecasts for the 2024 tornado season. The general sense is still that this will be a return to more traditional chasing season with April and May being the more active periods. This is partially due to the cold air already mentioned, as well as the displaced southerly jet. Another factor going for that is the continued progression of ENSO. Recent research has identified that a rapid transition from EL Nino to La Nina (or Vice Versa) during spring may be linked to a more active MJO that propagates quickly east of the international dateline. That type of MJO pattern has also been identified with very active stretches of western US troughing and some correlation with active stretches of US severe weather in the Spring. (Miller et al., 2022 Gensini et al., 2020 and Tippett 2018 ) While I don't specifically like to use Analogs as each year is unique, looking at similar ENSO evolutions paints a pretty interesting story for the later half of Spring over the Plains. Some big plains years are in the analog set. Even the quieter years still had robust plains seasons with notable events.

Years with similar ENSO transitions (500 mb Anomaly, CAPE Anomaly, and 850 mb north south wind Anomaly)
1706971918132.png
1706971938728.png
1706972690236.png
(850 mb meridional wind anomaly)


Summary:
  • Enjoy the warm weather while you can, I think it's 6 more weeks of winter, sorry Phil.
  • Cooler air is on the way and should keep severe weather quiet for the next few weeks.
  • Rain and precip should continue to ease drought over parts of the Plains.
  • Some interesting analogs are showing up for the rapid transition from El Nino to La Nina this Spring.
  • An Active MJO (linked to severe weather potential) is possible later in the spring with the transition.
  • I'll have the first round of spatial and number forecasts for MAM out in the next few days.
 
@adlyons

figured I would toss out a few Visuals to go along with your post. FEB&MAR NMME

1707157904111.png1707157948659.png1707157993797.png1707158027087.png
1707158114474.png

Reference: Kirtman, B. P., and Coauthors, 2014: The North American Multimodel Ensemble: Phase-I seasonal to interannual prediction; phase-2 toward developing intraseasonal prediction. Bull. Amer. Meteo. Soc., 95,585—601,doi:10.1175/BAMS-D-12-00050.1.

Acknowledgments: NMME project and data dissemination is supported by NOAA, NSF, NASA, and DOE. We would also like to acknowledge the help of NCEP, IRI, and NCAR personnel in creating, updating, and maintaining the NMME data archive.
 
@adlyons

figured I would toss out a few Visuals to go along with your post. FEB&MAR NMME

View attachment 24478View attachment 24479View attachment 24480View attachment 24481
View attachment 24482

Reference: Kirtman, B. P., and Coauthors, 2014: The North American Multimodel Ensemble: Phase-I seasonal to interannual prediction; phase-2 toward developing intraseasonal prediction. Bull. Amer. Meteo. Soc., 95,585—601,doi:10.1175/BAMS-D-12-00050.1.

Acknowledgments: NMME project and data dissemination is supported by NOAA, NSF, NASA, and DOE. We would also like to acknowledge the help of NCEP, IRI, and NCAR personnel in creating, updating, and maintaining the NMME data archive.


Nice! Glad to see they updated those. March certainly looks the part of a Classic El Nino with all the precip anomalies focused in the far southeast! I think the Euro Seasonal just posted yesterday.
 
Here are the latest EURO Seasonal plots.

1707233142621.png
1707233182561.png
1707233237406.png
1707233344946.png

All in all, not bad. Some pretty strong signals for below average geopotential height over the CONUS. I think thats probably dominated by March and early April signal.
 
It seems to me that most winters are informally capped off with an SSW event (beginning) in mid-late February. These events take 2-4 weeks to run their course, though, so if we get a big Arctic air outbreak in North America, it usually occurs a week or two after the SSW event starts. After that, though, we are usually done with truly cold winter air for the year, although "cool" air masses can still impact the CONUS from March onward.

I like to use Tomer Burg's (OU PhD student) stratospheric monitoring site to examine the potential for an SSW event. There used to be another really good graphics site out there with a unique URL, but I have since forgotten it. Anyway, there has been a major uptick in the likelihood of an SSW event in the next few weeks, as Andrew mentioned in a previous post. But we have been "enjoying" an El Nino winter so far, which I'll take over La Nina winters, both from a temperature and precipitation standpoint across most of the Plains (and especially into the innermountain West).
 
thought I would toss out JAN & FEB ENSO update to look at some comparisons for MAM and AMJ. it appears they have higher confidence in EL Nino lasting through MAM before really turning Neutral in AMJ. should be interesting to see what the other Drivers like the AO, PNO will be doing then in response to those changes in the April May timeframe, and of course whats happening with the MJO around that time as well.
 

Attachments

  • ENSO Jan.png
    ENSO Jan.png
    425.8 KB · Views: 7
  • ENSO Feb.jpg
    ENSO Feb.jpg
    131.6 KB · Views: 8
Great post Jason! Yes, it seems like our neutral chances have jumped up quite a bit toward the back half of Spring. CPC also issued an official "La Nina Watch" for summer. How that all affects the MJO I'm not sure. But with Jeffs's recent post about SSW we are mirroring a somewhat similar early transition like in 2010. It will be interesting to see how that all plays out!

Also, the Feb NMME Data has finished coming in. Below are some of the plots. Maybe some hints of eastern CA/US ridging in the temp anomalies? Precip anoms look fairly good for spring.
1707419875544.png
1707419930583.png
 
the precip map will be interesting to compare the trends over the next few times this data gets updated. Unfortunately, I don't have the Run Initialization date for this image and it's not showing the same parameter of course, but it was a Run before the one you just posted. would like to see more of this, kind of a trend analysis over the next month or two. Awesome!

1707422210508.png
 
It looks like the image issue has been fixed? With the GEFS now out through Mid March it looks like it's time to post the first seasonal look.

First, a broad overview of the atmosphere as it currently stands. We've been talking for a few weeks about the potential for a stratospheric warming event, which looks very likely now. This should lead to a weakening of the polar vortex, with some members even hinting at a fully split vortex, with lobes in northern Europe and possibly eastern North America. While the exact effects are still not quite evident, a weak vortex looks very likely as we head into early and even mid-late March. With a weak vortex, colder than average surface conditions and a southerly displaced jetstream would be the most likely pattern. The plot from Tomer Burg below tells the story quite well with some hints at even a record-weak vortex in the first week of March.
1707767014343.png


Ensemble data also supports this general trend with the latest GEFS showing lower geopotential height over the central US. Strong height anomalies are parked over the central and far southeast CONUS with stronger than normal northerly flow components also evident. That looks unlikely to change through the next several weeks. The net effect of this should be colder than normal air, offshore flow, weakened inland moisture transport, limited buoyancy, and the suppression of severe convection. Smart money also says we have several more winter storms across the central and eastern US.


1707767681496.png

1707767721674.png
1707768199637.png

With all that said, how is March looking for severe storms and tornadoes? Well, its not looking great.

Things working against March severe activity:
  • El Nino remains strong and we are still seeing typical influences with high-latitude blocking.
  • A rapidly weakening polar vortex may allow for cold air to leak south and remain in place over the CONUS through the next several weeks.
  • 500 mb height anoms suggest the continuation of a southerly displaced jet stream. 850 flow anomalies also show enhanced northerly (Negative V component) flow which may keep the expansion of the warm Gulf air mass suppressed through the first half of the month.
So how does this compare to typical March Climatology? Severe probs slowly increase over the Gulf Coast and begin expanding to the north and west through the Spring. This normal progression is usually modulated by the jet stream and the Gulf. The weakend polar vortex and displaced jet look to slow this process down.

severe_gif.gif

Let's make a forecast! Using what looks likely from the ensembles and climate models, here's my guess for tornado counts and confidence for the months of March, April and May.

Month1992-2022 Tornado Average 2023 ResultsForecast (Confidence)
March91206Below Normal (HIGH)
April184147Near Normal (LOW)
May270172Above Normal (MODERATE)
MAM Total545525 Below to near Normal (MODERATE)


Here are the first guess spatial forecasts. Quick Disclaimer: This information is experimental and in no way affiliated with NOAA or any official entity. Purely a storm chasing tornado anomaly forecast for fun.

MARCH

Keeping with the theme, I think march is going to be quiet over the typical southeast areas. COnfidence is fairly high, but one or two events that overperform could tip the scales closer to normal.
March_2024_forecast_Feb13.PNG

APRIL
April is where things start to look interesting. Most projections have ENSO quickly fading to neutral. Some long-range climate models also hint at stronger troughing retrograding west with the first hints of a southeastern/eastern US ridge. I've got dueling areas that could offset the count to near normal. Confidence is low in this transition time and there are some potential pitfalls. Lingering cold air and a transitional pattern could support northwest flow and blocking over the central US. Should this occur it would probably be earlier in the month and lower counts would be expected. Keys to watch for are the being of strong MJO/GWO cycles early in the month. Should these cross the dateline in the Pacific, strong troughing and a very active back half of the month could emerge. April seems to be a boom or bust month hence the low confidence.

April_2024_forecast_feb13.PNG
MAY

Finally everyone's favorite month. This looks like an exciting year for the Plains Chasers. The rain and snow have drastically cut the drought but retained some EML source regions farther west. We should be slipping further into neutral territory and the signal is growing for sustained troughing to the west and ridging off the eastern US coast. Enhanced southerly flow components also hint at above-normal tornado activity over the Plains in May. Confidence is moderate with much of the climate models agreeing on enhanced precip and a more active subtropical jet over the southern/central US. A poor northwest flow pattern or lingering cold air could potentially limit May. But I don't see as many failure modes here as the last several years. An interesting aside, there's a weak signal for above normal precip in the northeast. Typically this area is more of a June and July threat. Might we see some early severe in the upper Ohio Valley? Trying not to hype this, but the Plains look interesting for the first time in years. Could this continue into June as well?
May_2024_forecast_feb13.PNG


The plan is to update this periodically as we go through the Spring. Im hopeful we have some skill in predicting the spatial and count forecasts ahead of time. But again this is just for fun! What are everyone else's thoughts for Spring 2024?
 
@adlyons

I think your spatial assessment for all of the data that's currently out there looks pretty right to me. I think the variables that I have noticed that don't seem to track ,in my personal opinion, are some of the height anomaly forecasts compared to the precip and temperature forecasts. I suspect that's probably not abnormal to see disagreements of course, but based on what I have looked at, and what you drew for May, I would say that the southern end of your polygon seems more probable than the northern portion, at least based on some of the wind speed anomaly and height anomaly forecasts for April/May. I think the Southeast has a somewhat higher degree of severe probability this year, but not wide-spread outbreaks.

As for June??, as we transition into Neutral, at the pace it is expected/forecasted to occur, I just wonder what the net effects and response will be to the Jet-stream transition, as those changes occur but the precip/height anomalies, as they stand for the moment... seems??? favorable??? .. so, this is my TERRIBLE guess... cause that's all it really is when staring at data like this, lol (But it's fun to play)
 

Attachments

  • spatial forecast.jpg
    spatial forecast.jpg
    123.4 KB · Views: 33
@adlyons

I think your spatial assessment for all of the data that's currently out there looks pretty right to me. I think the variables that I have noticed that don't seem to track ,in my personal opinion, are some of the height anomaly forecasts compared to the precip and temperature forecasts. I suspect that's probably not abnormal to see disagreements of course, but based on what I have looked at, and what you drew for May, I would say that the southern end of your polygon seems more probable than the northern portion, at least based on some of the wind speed anomaly and height anomaly forecasts for April/May. I think the Southeast has a somewhat higher degree of severe probability this year, but not wide-spread outbreaks.

As for June??, as we transition into Neutral, at the pace it is expected/forecasted to occur, I just wonder what the net effects and response will be to the Jet-stream transition, as those changes occur but the precip/height anomalies, as they stand for the moment... seems??? favorable??? .. so, this is my TERRIBLE guess... cause that's all it really is when staring at data like this, lol (But it's fun to play)
That seems reasonable to me Jason! The northern end is definitely somewhat of a question mark. If the subtropical jet is more active I could certainly see a scenario that favors the southern half more than the north for sure. I like your thinking about June!
 
Hi All! First post from me, although I had discovered this forum last year before my first year of chasing in the States. I found this particular thread last year extremely valuable and I am sure this year will be no different. I've done a lot of reading on the effects on ENSO on tornadic activity and looking at analog years.

It's hard to disagree with the comments you have all made so far. I think in comparison to last year, we may start quiet and end active. As been already suggested I'll think we'll see an uptick through April and into May across the classic tornado alley, before shifting up into the Mid-west end of May and June. I have a funny feeling, June may deliver a few surprises this year!

It's hard not to be biased, particularly as I'm flying over to the States, at the end of May, for my second year of chasing (back to back) this year. Although, some very promising signs this spring so we'll have to see how things pans out.
Welcome to ST Ben!
 
Great posts and excellent data. Thanks. I was once told by "old time" forecasters in AMA, that strong El Niño conditions out west (western Texas and E. NM) were a mixed bag. Sometimes, lots of cloud cover, steady (non-SRV) rain and lost instability on otherwise big days, but higher soil RH content (e.g., dryline) for later in the season. We will see.
 
@Warren Faidley

I was looking at the current and short-term soil moisture outlook, something that Jeff Duda posted last year, which was helpful. It seems like the potential for a decent EML, at least over New Mexico to West TX will continue. How that sets up the conditions for an enhanced or loose Dry line gradients? probably isn't certain just yet, but definitely worth watching. Further north into Western KS/NE, it's not as clear right now, at least when you look at short range charts or the NMME and some of the GFS, GEFS, or Canadian CFS guidance.

I don't see that data as really useful in terms of actionable decision making, its either loosely aligned or vastly different potential/probability. which honestly is probably pretty normal given expected skill scores when looking out that far in advance. A watch is right 2 times a day kind thing, lol. But I honestly don't stare at it enough to really see trends, and understand what model works best for what parameter. There may be some decent Skill in a 3 month outlook? and I am just not aware of it.
 

Attachments

  • season_drought.png
    season_drought.png
    779.1 KB · Views: 11
@adlyons @Jeff Duda

asking you two intelligent guys. Are there are any good charts showing skill scores over time on long range trends for the above-mentioned models. I looked through the CPC site and found some skill score products, but it was more a map-based visualization for short range, but not a chart/graph showing the models skill over time. Essentially, I was curious to know at what point in the outlook does the skill fall through the floor, if at all, or is it a gentle slope downwards.
 
Last edited:
I use this site for soil RH content. Real-time 3km Land Information System over the SE U.S.

I believe you can adjust the region by going to the main site. It does not forecast soil RH.

There are options for comparing 1-week, 2, etc., to one year, which can suggest a trend. I have found over the last 37 years of chasing extensively in the western areas (E-NM, E-C0, W-K, W-TX), that higher, seasonal RH content does play a role preventing the dryline from mixing further east if everything else goes right, especially w/ surface winds. There is also a correlation between soil RH and climatology as higher levels sometimes means there is a more active pattern, but I've seen high RH soil years go bust. For me, higher soil RH also means less dust, which can kill chasing near the DL.
 
I use this site for soil RH content. Real-time 3km Land Information System over the SE U.S.

There are options for comparing 1-week, 2, etc., to one year, which can suggest a trend. I have found over the last 37 years of chasing extensively in the western areas (E-NM, E-C0, W-K, W-TX), that higher, seasonal RH content does play a role preventing the dryline from mixing further east if everything else goes right, especially w/ surface winds. There is also a correlation between soil RH and climatology as higher levels sometimes means there is a more active pattern, but I've seen high RH soil years go bust. For me, higher soil RH also means less dust, which can kill chasing near the DL.

The physics behind that are as follows:

The Southern Great Plains (SGP) dryline moves almost entirely due to vertical mixing rather than due to advection of dry air. That means vertical mixing is the key ingredient. Essentially we're talking PBL mixing. PBL mixing is, to a first order, driven by sensible heat flux (SH) at the land surface. As long as SH > 0 is true (i.e., during most of the daylight), the PBL can continue to mix and grow in depth. The vertical mixing of moisture within the PBL thus dictates how the DL will move. If the pre-existing moisture content is more shallow (typically the case at higher elevations), the mixing will "wipe out" the moisture in the area more quickly, and thus the DL will re-emerge at the edge of wherever the moisture was deeper and/or richer, which is almost always to the east/southeast in the SGP region.

The critical factor thus is the SH. SH doesn't come from nowhere - it comes out of a partitioning of the total available energy at the ground surface that responds to the classic 4-term equation: Rnet = SWdown + LWdown - (SWup + LWup). The minus sign is used to indicate direction (downward vs. upward). SW = "shortave" and refers to components directly from the sun, i.e., insolation and albedo effects. LW = "longwave" and reflects the transformation of the sun's (primarily) UV light into infrared by the Earth's surface. "SWdown" is more easily predictable since it depends on latitude and time of year, but later modified by cloud cover. "SWup" is generally a fixed fraction of SW down (again, albedo). "LWup" is just the Stefan-Boltzman Law for the ground, in which emitted LW energy is dependent on the 4th power of the radiative temperature (also referred to as skin temperature and the value of an IR satellite product pixel when there are no clouds). "LWdown" is a heat source for the ground dependent on the actual gaseous constituency of the atmospheric column over the ground - air has mass and emits energy, too. Some of that gets back to the ground. It's harder to precisely calculate this value, but field campaigns and model parameterizations suggest it is much smaller than the other components, so a big error in this term doesn't necessarily spell disaster when examining the surface energy budget.

Anyway, the net energy surplus or deficit, Rnet, is subsequently partitioned into three terms: Rnet = SH + LH + GH. LH = latent heat flux, which is the relevant term here. GH = ground heat flux and refers to energy that moves deeper below ground. This process can be small, but that doesn't mean it is isn't important. However, it is more complicated and I'm not going to delve into it. The key for this discussion is LH.

When the ground/soil is very wet, LH is going to be higher relative to SH (a term called the "Bowen ratio" = SH/LH, measures this). Since LH vs. SH vs. GH is a zero-sum game (actually, they sum to Rnet, but you get the idea), then if any one of these increases, the sum of the other two must decrease. Increased LH probably means SH is going to have to go down since GH has "less room to move" (if we could get soil temps to change rapidly, then this wouldn't be the case, but that's not how soil is constructed on Earth). Thus, taking the path of least resistance, we typically end up with less PBL mixing/shallower PBL, which will likely resist DL movement.

So yeah, that's how higher SGP moisture tends to mean further-west drylines.
 
Last edited:
I use this site for soil RH content. Real-time 3km Land Information System over the SE U.S.

I believe you can adjust the region by going to the main site. It does not forecast soil RH.

There are options for comparing 1-week, 2, etc., to one year, which can suggest a trend. I have found over the last 37 years of chasing extensively in the western areas (E-NM, E-C0, W-K, W-TX), that higher, seasonal RH content does play a role preventing the dryline from mixing further east if everything else goes right, especially w/ surface winds. There is also a correlation between soil RH and climatology as higher levels sometimes means there is a more active pattern, but I've seen high RH soil years go bust. For me, higher soil RH also means less dust, which can kill chasing near the DL.
Warren,

As soon as you mentioned comparisons. I remember Jeff also bringing that up last year about that as well. I think he even posted a link? gotta go back and look, I just forgot about them, thanks for the reminder.

More links for my favorites folder
 
Back
Top