Jamie H
EF3
It would possibly be more of an issue if the fires were in NM and effecting the EML right?
It would possibly be more of an issue if the fires were in NM and effecting the EML right?


Does anyone have any good analogs on good chasing years during El Nino transitions into Neutral (MAM / AMJ) readily available from possible past conversations on this question? ... I'd rather not duplicate effort just yet lol
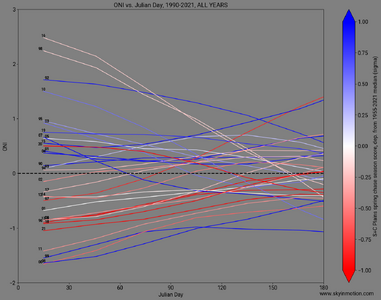
Great stuff as always Brett! I especially like your comment about the abundant early-season precipitation. I agree, things are trending toward a better-than-not year with more positive signs than bad ones like the past. Lets hope it stays that way!The ENSO trajectory from moderate-to-strong winter Nino toward neutral during the spring is my personal favorite for the Plains, for the simple reason that it's been reliable in a way no other general category has over the past 30 years.
If we're looking for spring transitions out of Nino events which peaked with an ONI of at least ~1.0°C, here are the cases this century thus far:
2019
2016
2010
2007
2003
I would argue every one of those had a better-than-average Plains chase season, by modern standards, with 2010 being an all-time great season. And crucially, all except 2003 had above-average winter-to-spring precipitation across most of the southern and central Plains, meaning that drought and overmixing were rarely or never a hindrance to chase setups.
Conversely, my least favorite ENSO trajectory is when we languish around neutral or weakly cool throughout the spring, possibly nudging toward a nascent Nino by mid-late summer. Several of the most horrific chase seasons in recent memory fit that profile. Last year worried me early on, but ended up pushing into Nino territory early and fiercely, and it turned out to be a pretty good season overall.
Of course, the problem here is that even ~30 years is still a really small sample size, when one considers the diversity of possible ENSO trajectories and the ways in which other global climate features can interact with them. You can look back further into the 20th century and find results that differ quite a bit from everything I just said, but the global climate base state has changed enough over the decades that I wonder how relevant that is.
Nonetheless, as someone who's chased since 2006 and has seen every year with 2024's general ENSO trajectory turn out quite well, I'm cautiously pumped. In my mind, the distribution implied by the small sample of years we have to work with suggests a "good" season for the southern-central Plains is more likely than a "bad" season... even if confidence is low enough that a somewhat "bad" year wouldn't be totally shocking. The relative glut of winter precipitation for most of the Plains bolsters that.
I really like Convective Chronicles. He has some great tutorial videos I like. And I really like his case studies on some historical events.@Jason N - Not sure if this is helpful to you, and I haven't had a chance to watch it myself, but Convective Chronicles has another forecast vid out. I was really impressed with last years video, and it seems he has a few analogs he touches on this year as well.
Brett,Of course, the problem here is that even ~30 years is still a really small sample size, when one considers the diversity of possible ENSO trajectories and the ways in which other global climate features can interact with them. You can look back further into the 20th century and find results that differ quite a bit from everything I just said, but the global climate base state has changed enough over the decades that I wonder how relevant that is.