State of the Chase Season 2024

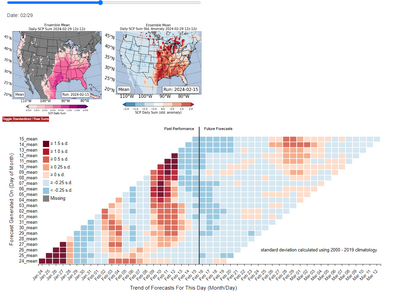
Also, I wanted to share with everyone a new tool I was recently made aware of. Victor Gensini and the folks at NIU have revived some of their chicklet charts using the extended GEFS. Chicklet Charts Here This might be useful out to several weeks. There's already an interesting signal for the last few days of Feb into the first couple of March.

1708092430067.png
 
Hi All! First post from me, although I had discovered this forum last year before my first year of chasing in the States. I found this particular thread last year extremely valuable and I am sure this year will be no different. I've done a lot of reading on the effects on ENSO on tornadic activity and looking at analog years.

It's hard to disagree with the comments you have all made so far. I think in comparison to last year, we may start quiet and end active. As been already suggested I'll think we'll see an uptick through April and into May across the classic tornado alley, before shifting up into the Mid-west end of May and June. I have a funny feeling, June may deliver a few surprises this year!

It's hard not to be biased, particularly as I'm flying over to the States, at the end of May, for my second year of chasing (back to back) this year. Although, some very promising signs this spring so we'll have to see how things pans out.
Welcome to ST Ben!
 
Great posts and excellent data. Thanks. I was once told by "old time" forecasters in AMA, that strong El Niño conditions out west (western Texas and E. NM) were a mixed bag. Sometimes, lots of cloud cover, steady (non-SRV) rain and lost instability on otherwise big days, but higher soil RH content (e.g., dryline) for later in the season. We will see.
 
@Warren Faidley

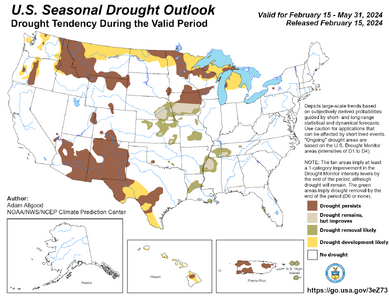
I was looking at the current and short-term soil moisture outlook, something that Jeff Duda posted last year, which was helpful. It seems like the potential for a decent EML, at least over New Mexico to West TX will continue. How that sets up the conditions for an enhanced or loose Dry line gradients? probably isn't certain just yet, but definitely worth watching. Further north into Western KS/NE, it's not as clear right now, at least when you look at short range charts or the NMME and some of the GFS, GEFS, or Canadian CFS guidance.

I don't see that data as really useful in terms of actionable decision making, its either loosely aligned or vastly different potential/probability. which honestly is probably pretty normal given expected skill scores when looking out that far in advance. A watch is right 2 times a day kind thing, lol. But I honestly don't stare at it enough to really see trends, and understand what model works best for what parameter. There may be some decent Skill in a 3 month outlook? and I am just not aware of it.
 

Attachments

  • season_drought.png
    season_drought.png
    779.1 KB · Views: 11
@adlyons @Jeff Duda

asking you two intelligent guys. Are there are any good charts showing skill scores over time on long range trends for the above-mentioned models. I looked through the CPC site and found some skill score products, but it was more a map-based visualization for short range, but not a chart/graph showing the models skill over time. Essentially, I was curious to know at what point in the outlook does the skill fall through the floor, if at all, or is it a gentle slope downwards.
 
Last edited:
I use this site for soil RH content. Real-time 3km Land Information System over the SE U.S.

I believe you can adjust the region by going to the main site. It does not forecast soil RH.

There are options for comparing 1-week, 2, etc., to one year, which can suggest a trend. I have found over the last 37 years of chasing extensively in the western areas (E-NM, E-C0, W-K, W-TX), that higher, seasonal RH content does play a role preventing the dryline from mixing further east if everything else goes right, especially w/ surface winds. There is also a correlation between soil RH and climatology as higher levels sometimes means there is a more active pattern, but I've seen high RH soil years go bust. For me, higher soil RH also means less dust, which can kill chasing near the DL.
 
I use this site for soil RH content. Real-time 3km Land Information System over the SE U.S.

There are options for comparing 1-week, 2, etc., to one year, which can suggest a trend. I have found over the last 37 years of chasing extensively in the western areas (E-NM, E-C0, W-K, W-TX), that higher, seasonal RH content does play a role preventing the dryline from mixing further east if everything else goes right, especially w/ surface winds. There is also a correlation between soil RH and climatology as higher levels sometimes means there is a more active pattern, but I've seen high RH soil years go bust. For me, higher soil RH also means less dust, which can kill chasing near the DL.

The physics behind that are as follows:

The Southern Great Plains (SGP) dryline moves almost entirely due to vertical mixing rather than due to advection of dry air. That means vertical mixing is the key ingredient. Essentially we're talking PBL mixing. PBL mixing is, to a first order, driven by sensible heat flux (SH) at the land surface. As long as SH > 0 is true (i.e., during most of the daylight), the PBL can continue to mix and grow in depth. The vertical mixing of moisture within the PBL thus dictates how the DL will move. If the pre-existing moisture content is more shallow (typically the case at higher elevations), the mixing will "wipe out" the moisture in the area more quickly, and thus the DL will re-emerge at the edge of wherever the moisture was deeper and/or richer, which is almost always to the east/southeast in the SGP region.

The critical factor thus is the SH. SH doesn't come from nowhere - it comes out of a partitioning of the total available energy at the ground surface that responds to the classic 4-term equation: Rnet = SWdown + LWdown - (SWup + LWup). The minus sign is used to indicate direction (downward vs. upward). SW = "shortave" and refers to components directly from the sun, i.e., insolation and albedo effects. LW = "longwave" and reflects the transformation of the sun's (primarily) UV light into infrared by the Earth's surface. "SWdown" is more easily predictable since it depends on latitude and time of year, but later modified by cloud cover. "SWup" is generally a fixed fraction of SW down (again, albedo). "LWup" is just the Stefan-Boltzman Law for the ground, in which emitted LW energy is dependent on the 4th power of the radiative temperature (also referred to as skin temperature and the value of an IR satellite product pixel when there are no clouds). "LWdown" is a heat source for the ground dependent on the actual gaseous constituency of the atmospheric column over the ground - air has mass and emits energy, too. Some of that gets back to the ground. It's harder to precisely calculate this value, but field campaigns and model parameterizations suggest it is much smaller than the other components, so a big error in this term doesn't necessarily spell disaster when examining the surface energy budget.

Anyway, the net energy surplus or deficit, Rnet, is subsequently partitioned into three terms: Rnet = SH + LH + GH. LH = latent heat flux, which is the relevant term here. GH = ground heat flux and refers to energy that moves deeper below ground. This process can be small, but that doesn't mean it is isn't important. However, it is more complicated and I'm not going to delve into it. The key for this discussion is LH.

When the ground/soil is very wet, LH is going to be higher relative to SH (a term called the "Bowen ratio" = SH/LH, measures this). Since LH vs. SH vs. GH is a zero-sum game (actually, they sum to Rnet, but you get the idea), then if any one of these increases, the sum of the other two must decrease. Increased LH probably means SH is going to have to go down since GH has "less room to move" (if we could get soil temps to change rapidly, then this wouldn't be the case, but that's not how soil is constructed on Earth). Thus, taking the path of least resistance, we typically end up with less PBL mixing/shallower PBL, which will likely resist DL movement.

So yeah, that's how higher SGP moisture tends to mean further-west drylines.
 
Last edited:
I use this site for soil RH content. Real-time 3km Land Information System over the SE U.S.

I believe you can adjust the region by going to the main site. It does not forecast soil RH.

There are options for comparing 1-week, 2, etc., to one year, which can suggest a trend. I have found over the last 37 years of chasing extensively in the western areas (E-NM, E-C0, W-K, W-TX), that higher, seasonal RH content does play a role preventing the dryline from mixing further east if everything else goes right, especially w/ surface winds. There is also a correlation between soil RH and climatology as higher levels sometimes means there is a more active pattern, but I've seen high RH soil years go bust. For me, higher soil RH also means less dust, which can kill chasing near the DL.
Warren,

As soon as you mentioned comparisons. I remember Jeff also bringing that up last year about that as well. I think he even posted a link? gotta go back and look, I just forgot about them, thanks for the reminder.

More links for my favorites folder
 
Looking like some type of severe weather event will take place early next week (2/27 - 2/28) from areas of eastern OK, northwestward into IL. Not going to re-post SPC graphics, but something watch. ATM, models hint of very fast moving HP cells. I'm sure the usual social media suspects will be posting "outbeak" alerts soon.
 
Looking like some type of severe weather event will take place early next week (2/27 - 2/28) from areas of eastern OK, northwestward into IL. Not going to re-post SPC graphics, but something watch. ATM, models hint of very fast moving HP cells. I'm sure the usual social media suspects will be posting "outbeak" alerts soon.
Been following this as well as I go onto night shifts. Still looks like some typical early-season issues with moisture and diurnal phasing. However, Ensemble support is there for a large trough or series of troughs to potentially support some early season chasing in the next 1-2 weeks.
 
I wonder what impact the widespread fires in Texas will have on moisture content now. :oops:
My guess would be not much, despite the impressive size of the burned area. There's already not a ton of surface vegetation there, and since it's February and little, if any, of that vegetation has started to green up, the lost potential evaporation is probably low. Also, since it's just Feb, there is a decent chance that by May or so, a lot of vegetation will have already started to grow back (provided it isn't dry as a bone there for weeks after this), which will restore some of that lost potential evaporation.

Finally, most of the moisture in that area advects in from other areas, so it may barely even be noticeable until we get into the greenest part of the year (and assuming the dryline doesn't find residence east of the area).
 
Back
Top