State of the Chase Season 2021

Status
Not open for further replies.
Regardless of any positive signs, man the climate models for AMJ are just resoundingly bad. Not even going to bother posting them, but the consensus from the ECMWF/NMME/CANSIPS/etc. is for another very dead season with a poleward retracted jet (even starting in April this time) along with some serious drought problems given torching temperatures and a lack of precip.

Andy, do you think these models were perhaps not taking into account the current winter storm unfolding across the region? After all, it is quite unusual for the Southern Plains to go into spring with any sort of snowpack on the ground. When I think of a bad La Nina chase season my mind immediately leaps to 2012 when it was very mild and dry the preceding winter with very little snowpack anywhere, and the entire Plains and Midwest basically started to bake in March and never stopped until late summer/early fall.

This year so far is behaving more like 2008 or 2011, with a quite active mid-late winter east of the Rockies. Still, it's interesting and somewhat disconcerting that the models would be in such unanimous agreement that flies in the face of the favorable indicators that have been discussed on this and other forums.
 
Again, the general thinking going into this year is that things look rather ominous for Dixie Alley, but more uncertain for the Plains/Midwest particularly in "prime" chase season of May into June (as is to be expected with a Nina). The climate models Andy B. posted about kind of throw a wrench into things, but of course they could easily be wrong at this range.

Although, like I said, I'm starting to think they might have been out to lunch since especially with the multiple rounds of widespread winter storms we just had, this year is behaving much more like a "wet" La Nina for the central CONUS than a "dry" one. Spring river flooding is already looming large as an upcoming issue in the Midwest, as it did in active springs like 2008 and 2011.
 
Linking a presentation that some of you may find interesting on the correlation between positive phase of the Trans-Nino index and large us tornado outbreaks. The presentation comes from Dr. Sang-ki Lee of NOAA AOML

Heres the skinny: "The decay phase of la nina (A positive trans-nino value) has been associated with a higher than average number of tornado outbreak and violent tornadoes days."

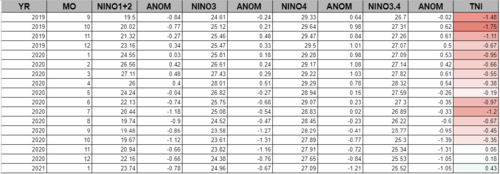
I updated some of my spreadsheets on ENSO and we have flipped from negative/neutral to a positive TNI. The last time this occurred was spring of 2017. Our values are weaker than past analogs so I still am hesitant to make direct comparisons to 2011 2008 ect. This is a weaker la nina transition, but there is still some evidence that the large scale pattern could favor some enhanced activity early to mid spring. Not sure how the ongoing drought will play into this, but here's some reading material.

1613748622281.png
 

Attachments

Hmmmm...2017 wasn't a great year for chasing but not the worst of the late 2010s (that distinction goes to the following year). A lot of setups that busted or underperformed including the late April sequence which had some tasty model runs but of which the Canton tornadoes ended up being the only major event; the mid-May high risk and the late May moderate risk (which was primarily issued for a big derecho but with the potential of a tornadic supercell or two on the tail end in northeast OK which never really materialized).
 
Linking a presentation that some of you may find interesting on the correlation between positive phase of the Trans-Nino index and large us tornado outbreaks. The presentation comes from Dr. Sang-ki Lee of NOAA AOML

Heres the skinny: "The decay phase of la nina (A positive trans-nino value) has been associated with a higher than average number of tornado outbreak and violent tornadoes days."

I updated some of my spreadsheets on ENSO and we have flipped from negative/neutral to a positive TNI. The last time this occurred was spring of 2017. Our values are weaker than past analogs so I still am hesitant to make direct comparisons to 2011 2008 ect. This is a weaker la nina transition, but there is still some evidence that the large scale pattern could favor some enhanced activity early to mid spring. Not sure how the ongoing drought will play into this, but here's some reading material.

Do you know if anyone has broken down the data by regions? I seem to remember a similar study where a positive trans-nino was associated with more activity in the eastern / SE US as opposed to the Central Plains, e.g., the 2011 Super Outbreak? Thanks.
 
Do you know if anyone has broken down the data by regions? I seem to remember a similar study where a positive trans-nino was associated with more activity in the eastern / SE US as opposed to the Central Plains, e.g., the 2011 Super Outbreak? Thanks.

Warren, there is a paper by the same author delving into a bit more detail on the topic, but other than that I am not aware of anything else on regionalizing the results. The presentation did hint at more activity across the southeastern US and the Midwest similar to what you said but it is a bit broad/vague.
 
Hmmmm...2017 wasn't a great year for chasing but not the worst of the late 2010s (that distinction goes to the following year). A lot of setups that busted or underperformed including the late April sequence which had some tasty model runs but of which the Canton tornadoes ended up being the only major event; the mid-May high risk and the late May moderate risk (which was primarily issued for a big derecho but with the potential of a tornadic supercell or two on the tail end in northeast OK which never really materialized).

I would definitely caution using 2017 as an analog as it was a substantially weaker La Nina. But, like you said, it was certainly not the worst year ever. I only include that as a reference to the last time we had even remotely similar conditions. Prior to that, 2015 also had positive TNI values but temporally displaced from the method(Single year la nina decay) mentioned in the presentation.
 
The Euro has been hinting at our first run at a limited severe weather threat on the Southern Plains early next week. Looks to have all the classic problems of an early March setup between cloud cover and uncertain warm front placement but something that may bear watching.

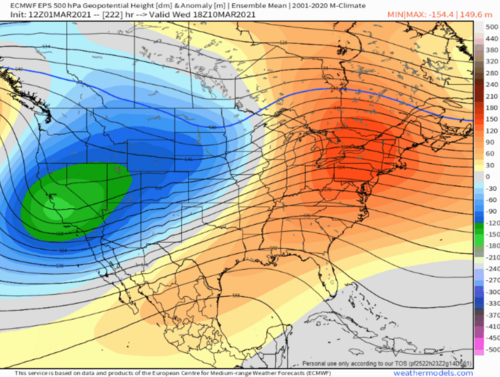
Both the GFS and Euro seem to be pointing to the Southern Plains and Dixie getting some Baja cutoffs mixed in with the overall west coast troughing through hour 240 from the 00Z runs last night/the GFS' 12Z run this morning. Might be interesting to see how our mid-late March shapes up should that type of pattern persist.
 
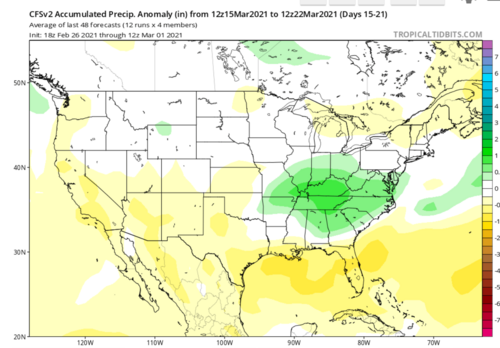
Various model data continues to suggest severe weather potentials for parts of the Plains and Dixie beginning around the middle of the month. Still too much uncertainty to begin hashing out the finer details, however the overall trend does suggest an active second half of March may be in the cards. Really hoping for chasing ops west of I-35 this year, particularly in Kansas. Most spring severe weather outlooks place the bulk of the activity east of I-35 and into the Midwest and Dixie. There are not many positive signs that the ongoing drought in the southwest sees much improvement over the next couple of weeks. The GFS is more bullish on QPF over the southern high plains vs. the Euro. Either way, it appears drought conditions will persist, perhaps worsen in some areas. Right now it's difficult for me to to have a ton of optimism, however I doubt this year will be as bad as 2020.
 
For those who ventured out this past weekend... how are gas prices doing in the Central US? We will soon be at $3.00 per gallon here in AZ (was $1.99 in October) and I'm expecting at least $4.00+ in chase regions by May.
 
Gasoline prices are around $2.25 in Tennessee, and have been somewhat stable for weeks. Our fall low was $1.75. We generally do not stray too far from Kansas and Texas. All are more stable than the Desert Southwest. I'm not sure about Oklahoma. I expect a little spring creep, maybe $2.50 or close to $2.75 some weeks; but, I think <3. Not commodity or futures investment advice.

Mid-Range the weekly models have shown that trough west with SER look mid-month; and, operational models are similar now in the 11-15 day period. Weeks 2-3 are the edge of any forecast value; but, it's nice they agree. Forecast AO/NAO is positive. Bering Sea ridge (not Alaska) could anchor the downstream West or Rockies (then Plains) trough.

Severe Season overall I'm somewhat bullish, but not crazy lit. I see La Nina hanging in there. It's not a pure La Nina resurgence since it's still first year, but it has that bullish lean for severe. Recent MJO activity and Kelvin wave placement in the Tropical Pacific has juiced the La Nina status (esp 3.4 region). +TNI is in question. Right off South America (region 1&2) is still cool. It had been warning up; but, the said activity impacted the whole basin. If 1&2 can warm to near or above normal, while 3.4 stays cooler than normal, then we have +TNI flavor. Either are bullish. Missing one should not be bearish if the other holds.

That said I reject the 2011 mayhem. 2011 was true resurgent La Nina - which has a much more bullish correlation than first year. I don't recall the 2011 TNI but it was probably not the driver if Nina was surging. I like 2012 and 2008 more than recent La Ninas, basically approximate strength and trend (holding rather than fading). Those years had their days, maybe not all season. They were better than 2017 or 2018.

Bottom Line: I'm cautiously optimistic about storm chasing this year. At the same time I pray (and forecast) it's no 2011.
 
For those who ventured out this past weekend... how are gas prices doing in the Central US? We will soon be at $3.00 per gallon here in AZ (was $1.99 in October) and I'm expecting at least $4.00+ in chase regions by May.

GasBuddy is your friend here:

 
2.91 is the highest I've seen near my hometown in IL. Went up from the 2.40s a few weeks back to almost 3 dollars a gallon real quick-like. I suspect we will see 2011-12 prices by summer sadly. If that is the case I will likely limit my chasing to one or two trips to the plains tops and mostly local setups, pending they actually happen.
 
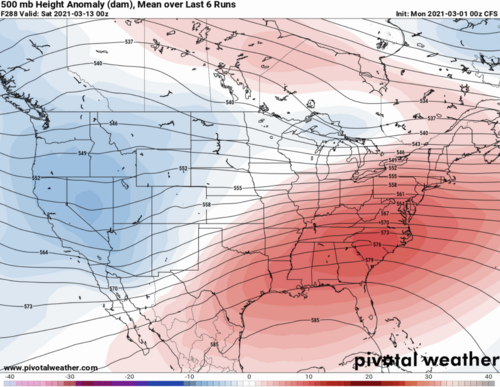
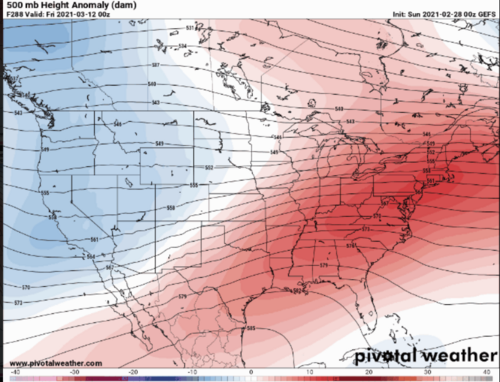
From about the 240 hr onward on almost all guidance feature some interesting things we would typically see with deep south and/or midwestern severe weather. Unfortunately GIFS are too powerful for this msg board. but use your imagination a bit here. We see "the look" from mid march all the way out to April 1 on extended runs of the ensembles, weeklies, etc. Almost unanimously.

Initial waves will have to overcome (read: they won't) poor moisture return due to a crashing cold front prior to the period all the way to the Cayman's.

However, save for any additional crashing, subsequent troughs will not have this problem. Now, observation of the EML..we are going to really need those March thermals to reach A+ levels before any significant severe event can take place.

At any rate, Likely BA conditions until about March 15 timeframe, with AA conditions tentatively expected for the back half of March.

P.S. Let's repeat this pattern precisely two months later.

1614633547883.png1614633643433.png1614633671662.png1614634038945.png
 
Status
Not open for further replies.
Back
Top