JamesCaruso
Staff member
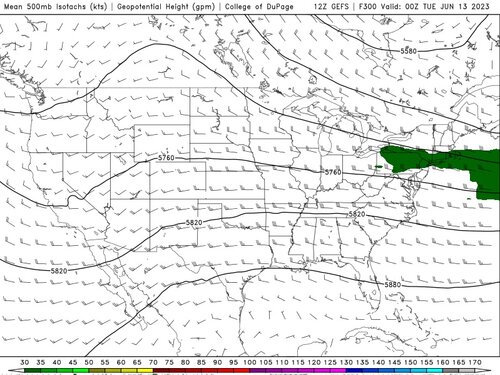
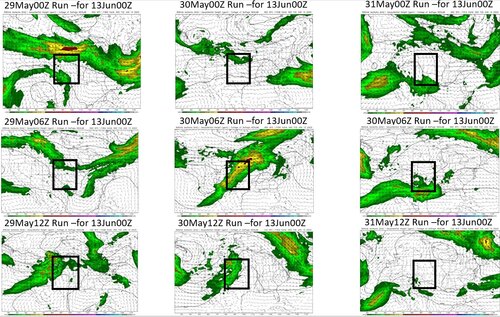
Current chiclet chart is favorable for the period roughly centered around 6/9-6/14 but when I look at the 500mb charts for the same period I just don't see it until the last day or two (a couple of representative charts from the period inserted below). Can anyone explain this?? If it's because the timing of the products is out of sync, then such run-to-run variability alone is reason to discount it...


.png")