Thoughts about the upcoming 2015 chase season

It will be interesting to see how a lack of a deep snow pack across much of the northern plains affects things. Unless things change, I'd "guess" there will be a fairly quick warm up in the middle of the Country once the pattern does change. Will it mean severe weather? Who knows, just one of many things to consider.

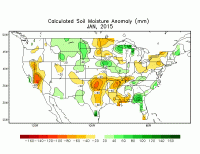
Definitely a consideration and the resulting drought growth from the dry fall/winter may be a factor. My thinking is these regions will warm more than others further south that have had precipitation. This could assist in the warm sector dominating spring setups, speeding up the overall spring season resulting in less southern Plains storms. There has been some precipitation across the south this past year improving soil moisture from last year at this time. Compare soil moisture from 1/2014 to 1/2015 in attached images. Increased soil moisture across the southern Plains may help in the northward transport of Gulf moisture. It is important to note too that drought (and soil moisture) are actually about the same for the upper MS River basin, albeit, shifted slightly further north this year. So in reality, there may not be a trend towards much different of a season than 2014.

With a climatology trend towards neutrality in the ENSO going into spring/summer there is no clear signal (and probably won't be) any true guidance into spring. We really need to get a -PDO to get me excited so we can get more troughing in the west. Also, without a big swing in moisture to the west, I don't believe we will see an active southern US without help from a tropical/monsoonal like pattern. Problem with those is that they usually are split flow, and as already mentioned, isn't ideal for large events. Plus they typically occur late in the season and low levels just can't support decent storms. Therefore, I am leaning towards a short spring season to the south and a more active season across the north-central and northern Plains. Wouldn't complain if I am wrong though, have yet to see a tornado in Kansas since I moved here in 2013.

Chip
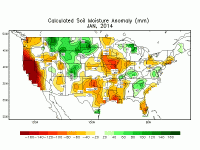
140101-jan-soiilmoisture.gif 150101-han-moisture.gif
 
Some of you may recall my post last winter about a simplistic scoring system for chase seasons I developed. My motivation was eventually to use these scores as a basis for analog forecasting. Recently, I've begun to explore this by calculating correlation coefficients between climate/teleconnection indices and the scores I've calculated. Thus far, I've done so for these indices: AO, NAO, ONI, PDO, PNA, QBO, WPO. For each index, I'm looking at correlations for mean index values at various lead times and durations.

Because the sample size is N~60 (complete Storm Data, and thus my scores, are only available back to 1955), correlation coefficients of |rho| > 0.21 are considered statistically significant. At lead times of several months (i.e., climate index values during the wintertime), two indices appear to have statistically significant correlations to the quality of the subsequent Plains chase season: the Arctic Oscillation (AO), and the Pacific Decadal Oscillation (PDO). Specifically, a positive correlation exists for the AO, and a negative correlation exists for the PDO.

In very simplistic terms, the Arctic Oscillation represents the surface pressure gradient between the Arctic and the sub-Arctic north Atlantic (i.e., between the northeast US and western Europe, equatorward of 50°N). A positive AO indicates a relatively strong gradient, with low pressure anomalies over the Arctic and high pressure anomalies to the south; this is associated with relatively strong westerlies over high latitudes, which helps to limit Arctic air intrusions into the midlatitudes (at least on average over the northern Hemisphere). A negative AO indicates the opposite, with weakened westerlies around the Arctic Circle and a greater tendency for Arctic air to spill southward.

The Pacific Decadal Oscillation is based entirely on SST anomalies, and can be thought of similarly to ENSO, but calculated for the northern Pacific (specifically, along and near the North American coast from around Oregon up to the Gulf of Alaska). A +PDO is associated with warm SST anomalies, while a -PDO is associated with cold anomalies.

This winter, the mean value for the AO has been positive, despite the frequent cold intrusions into the eastern half of the CONUS during Jan-Feb. This can be seen as a "good sign" for the chase season, as rho(PDO_Dec-Jan, Score_Mar-Jun) = +0.33. The correlation for the AO actually peaks at this lead time, becoming less significant as we move into Feb-Mar-Apr (which makes sense, as the AO is primarily a wintertime mode).

On the other hand, the PDO is literally off-the-charts positive this winter: SST anomalies along the northern Pacific coast have been the warmest on record since 1900 for Dec-Jan. This can be seen as a "bad sign" for chase season. One difference between the AO and PDO correlations, however, is that the negative PDO correlation continues to increase in magnitude as we move into spring, peaking for the April-June period (rho = -0.30). Thus, if the +PDO can somehow fall off rapidly over the next 60 days, this may not be as much of a factor. That seems unlikely, though, as warm SST anomalies over the far eastern Pacific have only increased between late January and now.

Looking a little more closely at sub-regions of the Plains, the coefficients would imply that a +AO is more "beneficial" to the northern Plains than southern Plains, whereas a +PDO is more "harmful" to the southern Plains than northern Plains. However, I'm even less comfortable making claims about smaller spatiotemporal windows, as the scores tend to be "sparser" (i.e., for a small region over a short period of the year, there are lots of quiet years and only a few active years). Even for the Plains-wide coefficients I discussed above, the limited sample size and modest values (|rho| ~ 0.3) means any practical inferences should be made cautiously. I figured I'd share just to break up the winter doldroms a bit, though. I'll be sure to post again if I have any new findings of significance - and as always, comments/questions/complaints are welcome.
 
I may be missing something, but it doesn't look like I can edit my previous post. I was planning to add a couple scatter plots for the AO and PDO, so I'll just post them here.

Plains score for Mar-Jun vs. AO for Dec-Jan

Plains score for Mar-Jun vs. PDO for Dec-Feb

It's interesting to note that the overwhelming majority of the bottom quartile of years (score < ~30) featured a -AO during Dec-Jan, giving some hope that we won't see a dismal season in the vein of 2006 or 1988. On the other hand, none of the top quartile of years (score > ~50) had a PDO > 0.5 during Dec-Feb, suggesting long odds for a banner season. So basically, all this number-crunching has me going out on a limb and leaning toward something in the ballpark of an average year for the Plains. ;)
 
Last edited:
Some great stuff there Brett.

I think my main concern is the PDO staying as strong as it is now and repeatedly resulting in +PNA ridge amplification as it has done in January and February. As Jeff mentioned on a previous page, this would likely result in NW flow over the Plains and potentially further east and repeated cold shots (although it won't be of the frigid nature of Feb obviously) something like we have seen the past two years with CAD east of the Rockies. With that said, I'm wondering how the waves shortening deeper into spring will impact this, since this has been more of a locked-in longwave pattern in February (hence the often unfavorable track for SE/Mid-Atlantic snowstorms and historic New England storms). I definitely don't like how the years that held with a +PDO >1.0 look through spring though overall.
 
The ridge breaks down ever so slightly towards the end of the 192 hour period but it's looking like with how thermally reinforced it is by the warm SSTs that the Plains/Midwest will get multiple winter weather events in a relatively short time.
MhwZYjO.gif
 
Last edited:
Just to clear it up, it takes 5 consecutive overlapping 3 months seasons of +0.5°C or -0.5°C to be declared El Nino or La Nina by the CPC. To date we are at 3 and will need DJF and JFM to be at +0.5°. It seems that DJF will be number 4, but we won't know about JFM until the first of April at which time ENSO will be declared Nino or not. Until then, it is just ENSO neutral...still premature to call it El Nino by our standard (CPC).

2011 was a strong La Nina year and there were tornadoes even into the northeast (30 in Pa and 21 in N.Y.) 1998 saw 59 tornadoes in Pa and 19 in N.Y., 11 Md and that was a neutral time. 1985 was a weak la Nino during the northeast mega-outbreak. 1974 had a moderate La Nino during the superoutbreak. Last year was neutral and N.C. had a lot of tornadoes. The November outbreak of 2013 was under neutral along with el reno outbreak occured under neutral. The 2008 outbreaks in May occurred under a weak La Nina. 2007 Greenburg, Kn outbreak under neutral. OK HERE WE GO 2004 NOV outbreak under weak El Nino, lol.

El Ninos seem to stink for tornado outbreaks.

You mean La Nina.

Greensburg was coming out of a weak-moderate Nino in 2007. 2008 was coming out of a moderate-strong Nina. If you think El Ninos suck for tornado outbreaks, tell that to 6/1992, 5-6/1995, 5-6/2003, 1998 as a whole, late April through June 2010, etc. etc.

1973 was a strong Nino and was even more active overall in terms of tornado count (although not significant/violent tornadoes because of the Super Outbreak) than 1974.

You can go back further and look at years like 1930 and 1942, which had some of the highest "violent" tornado counts prior to 1950, which were Nino events. I say violent in quotations because tornado ratings in that era are not official, but Grazulis' database indicates that there was an excess in major tornado activity in those years. You can't just make blanket statements like your last one there without actually going through the data. Just recently within the last quarter century there are clearly a number of years that directly contradict that reasoning. ENSO status simply does not purely dictate how active a season will be.
 
I was looking at month to month el nino/La Nina strength from climatological records. I was picking out outbreaks with 100 or more and some recent events.
 
I was looking at month to month el nino/La Nina strength from climatological records. I was picking out outbreaks with 100 or more and some recent events.

Picking out outbreaks with 100 or more tornadoes severely restricts any correlation (if said correlation exists) you're going to have with a particular teleconnection because the sample size is far too small. Then, going on and blanketing everything with "El Nino sucks for tornado outbreaks" based on this limit number of samples is nonsensical. As someone who has studied tornado climatology and historical events since I was 4-5 years old, what you are doing just doesn't cut the mustard.
 
Back
Top