StephenHenry
EF3
First of all, let me say there's a lot of interesting discussion in the StormTrack Discord. Check if out if you haven't already.
I started this fun little project initially to lob a good-natured jab at the ongoing hype-despair-hype cycle ever present in the ST Discord - most obviously in the #long-range-discussion room. I'll walk you through the setup and steps for a simple Sentiment Analysis of the posts harvested from that room over time. It's actually quite easy and maybe someone will find this setup useful in another application.
Experimental Framework:

I was curious if the cycles of excitement and panic would show up via a simple, automated text analysis. In this framework, long range model outputs, chiclet charts, oscillation plumes, etc. serve as inputs to each user's neural network, which is trained on (possibly many years) of past weather data inputs. These neural nets produce outputs consisting of various degrees of meme, sh*t, and analysis posts. These outputs are conveniently aggregated on the StormTrack Discord #long-range-discussion board. For simplicity, I haven't shown the flow of information back from the Discord into the users neural nets, but this is definitely a feedback loop that shouldn't be discounted. Finally by harvesting and processing each post, the text is analyzed by a industry standard Sentiment Analysis classification API. I'll take you through each of my steps to show how easy it actually is and then show some results.
Step 1: Harvest the Discord data
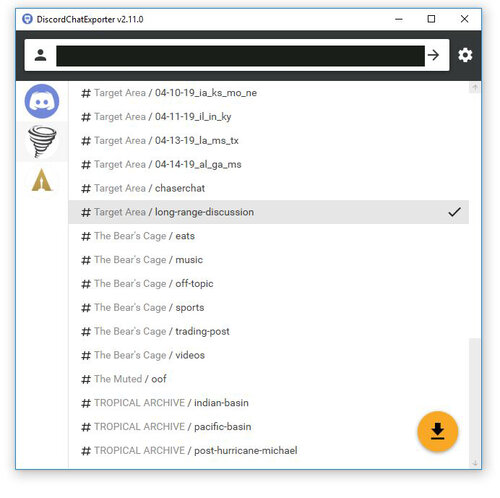
This step was surprisingly trivial thanks to an existing GitHub project found here: https://github.com/Tyrrrz/DiscordChatExporter. The hardest part is figuring out your Discord user key so that the tool can access your servers. Otherwise, you can select how the text is exported (CSV is the best option) as well as a timeframe from which to get the posts.
Step 2: Prepare the Data
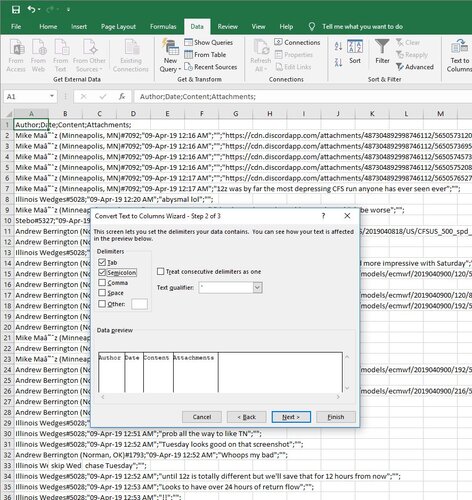
Again, this step is super easy. You just need to separate the CSV Discord file into individual columns, which is trivial using the semi-colon delimiter.
Step 3: Perform Sentiment Analysis on each post
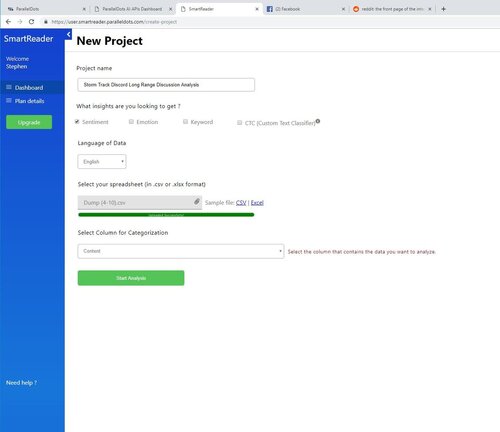
I tested a few different Sentiment Analysis sites and honed in on ParallelDots simple API. which provides a basic "Positive", "Neutral", or "Negative" classification of each post (it does more, but that's all I used). You submit your text for classification as a CSV file (again, very handy since that's how I dumped it from Discord). Upload your file, tell the site which column has your text for analysis, then get back a new CSV file with a new column storing the classification for each post.
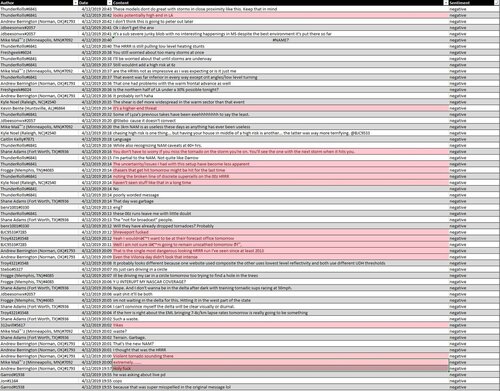
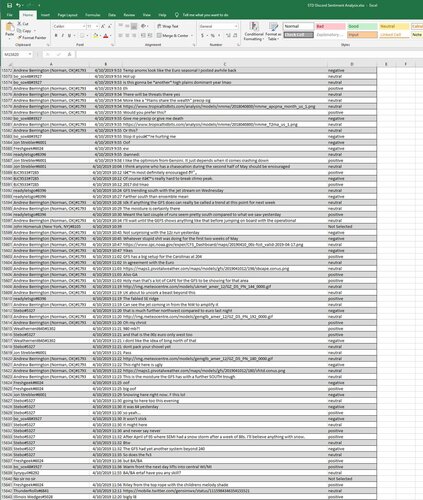
Here's a sample of some of the classified text. You can see that the classifications aren't perfect, but they are pretty impressive and it beats manually classifying each of 16,000 posts.
Hourly Results:
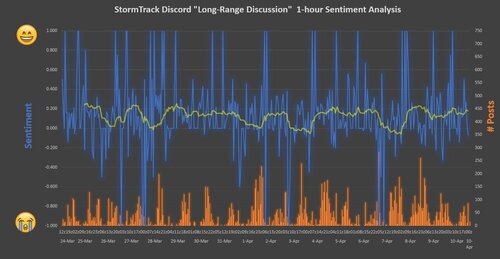
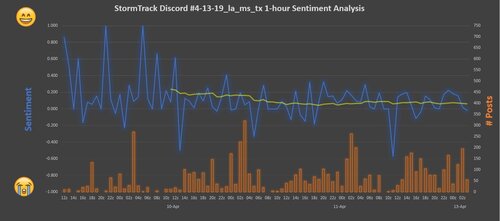
This chart shows the hourly sentiment trends in the #long-range-discussion room since March 24th. Blue is the aggregate sentiment (average of # of positive, neutral, and negative posts in that hour). If all posts are positive, Sentiment = 1; if all are negative, Sentiment = -1. If all posts are Neutral or there was an equal number of Positive and Negative posts, Sentiment = 0. The orange bars show the number of posts each hour and nicely captures the daily post rhythm. The yellow line is a 2-day moving average of the aggregate sentiment. While there are definitely some significant spikes and dips indicative of the swings I was originally poking fun at, you can see that the average sentiment has remained slightly in the positive though the last couple weeks. Most spikes occur in hours with smaller post count. My quick and dirty analysis doesn't filter those out in a fair way at this point.
6-hour Results:
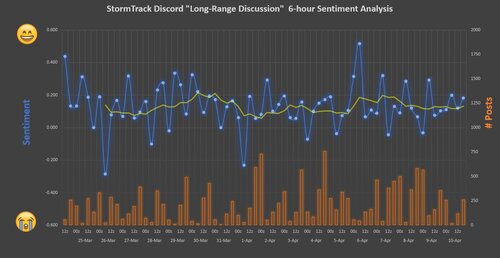
This chart is the same as the last one, but accumulates posts over 6 hour increments. Here you can clearly see the up and down swings with a roughly 1/2 to 1-day periodicity. The nice thing about aggregating over 6 hours is that it washes out the effect of low-post-extreme-sentiment hours. Interestingly, the last day and a half has been one of the most stable periods of the study, exhibiting relatively steady positive sentiment in a narrow band.
Final thoughts:
Obviously this is just for fun and not at all scientific. Possible problems that come to mind include
I started this fun little project initially to lob a good-natured jab at the ongoing hype-despair-hype cycle ever present in the ST Discord - most obviously in the #long-range-discussion room. I'll walk you through the setup and steps for a simple Sentiment Analysis of the posts harvested from that room over time. It's actually quite easy and maybe someone will find this setup useful in another application.
Experimental Framework:

I was curious if the cycles of excitement and panic would show up via a simple, automated text analysis. In this framework, long range model outputs, chiclet charts, oscillation plumes, etc. serve as inputs to each user's neural network, which is trained on (possibly many years) of past weather data inputs. These neural nets produce outputs consisting of various degrees of meme, sh*t, and analysis posts. These outputs are conveniently aggregated on the StormTrack Discord #long-range-discussion board. For simplicity, I haven't shown the flow of information back from the Discord into the users neural nets, but this is definitely a feedback loop that shouldn't be discounted. Finally by harvesting and processing each post, the text is analyzed by a industry standard Sentiment Analysis classification API. I'll take you through each of my steps to show how easy it actually is and then show some results.
Step 1: Harvest the Discord data

This step was surprisingly trivial thanks to an existing GitHub project found here: https://github.com/Tyrrrz/DiscordChatExporter. The hardest part is figuring out your Discord user key so that the tool can access your servers. Otherwise, you can select how the text is exported (CSV is the best option) as well as a timeframe from which to get the posts.
Step 2: Prepare the Data

Again, this step is super easy. You just need to separate the CSV Discord file into individual columns, which is trivial using the semi-colon delimiter.
Step 3: Perform Sentiment Analysis on each post

I tested a few different Sentiment Analysis sites and honed in on ParallelDots simple API. which provides a basic "Positive", "Neutral", or "Negative" classification of each post (it does more, but that's all I used). You submit your text for classification as a CSV file (again, very handy since that's how I dumped it from Discord). Upload your file, tell the site which column has your text for analysis, then get back a new CSV file with a new column storing the classification for each post.
Here's a sample of some of the classified text. You can see that the classifications aren't perfect, but they are pretty impressive and it beats manually classifying each of 16,000 posts.

Hourly Results:

This chart shows the hourly sentiment trends in the #long-range-discussion room since March 24th. Blue is the aggregate sentiment (average of # of positive, neutral, and negative posts in that hour). If all posts are positive, Sentiment = 1; if all are negative, Sentiment = -1. If all posts are Neutral or there was an equal number of Positive and Negative posts, Sentiment = 0. The orange bars show the number of posts each hour and nicely captures the daily post rhythm. The yellow line is a 2-day moving average of the aggregate sentiment. While there are definitely some significant spikes and dips indicative of the swings I was originally poking fun at, you can see that the average sentiment has remained slightly in the positive though the last couple weeks. Most spikes occur in hours with smaller post count. My quick and dirty analysis doesn't filter those out in a fair way at this point.
6-hour Results:

This chart is the same as the last one, but accumulates posts over 6 hour increments. Here you can clearly see the up and down swings with a roughly 1/2 to 1-day periodicity. The nice thing about aggregating over 6 hours is that it washes out the effect of low-post-extreme-sentiment hours. Interestingly, the last day and a half has been one of the most stable periods of the study, exhibiting relatively steady positive sentiment in a narrow band.
Final thoughts:
Obviously this is just for fun and not at all scientific. Possible problems that come to mind include
- Extreme jargon, shorthand, acronyms, made up memes unique to that room
- Noisy posts that are not about the "season" but are more meta about the state of the room or just completely off topic
- Non-uniformity of user participation
- Often, discussion moves to another room and you basically lose signal
Last edited:


