June 4th 2005:the lack of an extensive supercell development

The 21z map looks awesome, but that trough that drops SSW from the low and curves back to the SSE seems a bit odd. The ICT ob (I think it's ICT), with a SSW surface wind and a 67F dewpoint, looks like it'd fit the air behind the trough better than ahead of it. Most of se KS (ahead of that low and trough) has Tds of 70-72, with SSE winds, while the area behind that trough has mid-60 Tds and SSW-SW winds (which fit the ICT ob better). Regardless, it isn't as tilted NNE-SSW as I remember it... Then again, I was in MN that period for my bro's graduation, so I wasn't able to pay attn to the situation the entire time.
 
Ha, well thanks Jeff. It was a messy surface environment for sure - well, at least as I analyzed it, things are rather messy. I'd welcome you to try the analysis seperately, you may well see things differently from me, but the pressure falls are so large I don't think you'll find many winds behaving nicely, there was just a lot of convergence, especially compared to just 3 hrs prior. The surface ob pressure you can't see under the L (just nw of ICT) had the lowest observed pressure, 003, but the pressure fall minima was well to the northeast (-18 ), and another maxima almost as strong back in central OK. Probably should have done hourly analyses, but I just didn't have the free time. The obs are from the SPC archive for anyone interested in doing this.

Glen
 
I'd welcome you to try the analysis seperately, you may well see things differently from me
No doubt it was a lot of work, and I wasn't trying to dis your analysis! It looks messy, but that single ob just stood out to me. I didn't think about isallobaric responses, which would veer the winds at ICT as the core of the strongest pressure falls shifted away from the area. Too bad there isn't an OK Mesonet-quality meteogram available, as it'd be interesting to see the dewpoint and pressure traces from that time.
 
Well, I can read them off the hourly plots at least:

19Z 85/68 1001.5mb S@20
20Z 87/69 1001.1mb S@20
21Z 87/67 1000.7mb SSW@20
22Z 89/66 1000.5mb SW@15
23Z 89/64 1000.1mb SW@15

So, there is a slight trend in the dewpoint and temp but this is during afternoon heating - so may just be a sign of a deepening boundary layer, and the pressure continues to fall through the duration, so it's tough to note any real change in air mass from that. The winds slowly veer, but yeah, may be due to the issallobaric response, but as you noted, not a lot of information to go on.

Glen
 
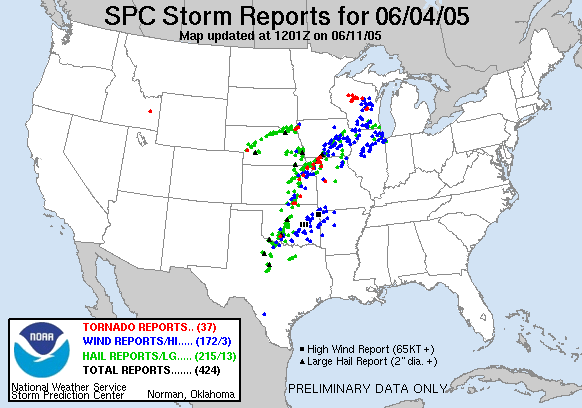
Wind profiles were extremely favorable for tornadoes across Wisconsin that day...if grunge convection had not covered the state for most of the day it could have rivaled August 18th (with the tornado watch continuing well into the night, I thought June 7-8,1984 could have turned out to be a better paralell :shock: ). As it worked out about 20 brief F0-F1s managed to form out of the low-instability linear crap and (very) tiny discrete mini-supercells.

050604_rpts.gif


This is a tornadic storm, believe it or not:

jun042005_4.png
 
I'll be the first to admit the surface obs looked like crap before and even during the event. Maybe someone with a deeper understanding of the NSE for this event would like to comment. It's hard to tell if the area to the north of the initiation are was effected by subsidence (i.e. a meso high of sorts?) from the earlier convection or if there is in fact a subtle boundary which was left over. Mike is correct...just write it off as another of the weird circumstances for the day I guess.

satellite_vis_ict_200506041600.jpg


satellite_vis_ict_200506041900.jpg


satellite_vis_ict_200506042000.jpg


satellite_vis_ict_200506042030.jpg


satellite_vis_ict_200506042100.jpg
 
Back
Top