I'm going to go along a tangent that Greg brought up and talk a little about the SREF ensemble forecast for a few locations...
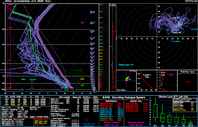
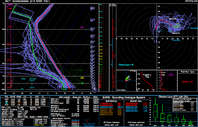
I've uploaded 21Z SREF soundings for 2 locations: Ponca City, OK, and Wichita, KS. If you would like to look at other locations, I would be more than happy to generate and upload them for further discussion.
For starters, I think this excellently displays just how much uncertainty there is in this forecast, and that it is vital to utilize every tool available to interrogate what this system is actually doing. This is also why I am/will be paying very close attention to the observations over the next few days, and supplement that information with subsequent model runs. Side rant: we are within the range of predictability based on observations, it's time to start using them!
While this discussion is primarily based on the KPNC sounding (my current target), these thoughts still apply for the other profile. Some important things that jump out at me:
1) There is considerably STRONG agreement on the mid/upper level lapse rates for this event. Nearly all ensemble members follow the same trace with only slight displacements to the left/right of the mean SREF member that is displayed. This is good - mid level lapse rates play a crucial part in parcel buoyancy in addition to the fact that steep mid level lapse rates allow for a more robust mass response at the surface when speaking from a QG/Synoptic lift perspective. Seeing such good agreement on this part is encouraging.
2) Low level lapse rates start to take on a little more ensemble spread. It's a little hard to see because they get so clustered, but there's essentially a clustering of models that mix out to the high 70s, and another clustering in the lower 70s. This could be due to a number of factors, including, but not limited to differences in EML strength at 850mb, and early convective initiation/outflow contamination. The NAM 4km has consistently blown up convection around 22-23Z, so at least a few of these may be convectively contaminated. I don't have the time to interrogate every SREF member, but it would be a good homework assignment if someone is interested in investigating the spread in the surface temperature forecast

.
3) Dewpoints... HOLY SPREAD! As I'm sure this does not come as a surprise to anyone, the moisture profile spread in the low levels is rather large. We have all the way from 57 up to mid/upper 60s. This is likely a function of spread in 1) dryline placement, intensity of mixing, and depth of moisture. I tend to ignore the moisture spreads in the higher levels, but it should be noted that there is a lot of spread in the depth of moisture as well. Convective contamination from some members may be part of the problem here too. Again - I have not interrogated every member. I am, however, encouraged by the clustering of ensemble members that have higher than/near the mean DPs. Usually these clusterings are ensemble members with the same dynamical core (i.e. NMM/ARW), so it would be interesting to see which ones are clustering on the lower/higher ends.
4) Hodograph... HOLY FREAKING SPREAD BATMAN! I think this is an excellent example of how small uncertainties/changes in the wind profile can make huge differences. I mean, you have everything in there from beautiful sickles to ugly S shaped curves to N curves, etc. However, there is a trend in the mean to a sort of veer-back-veer profile as seen in the colored trace... not super thrilled about that. It's relatively high up compared to the effective inflow layer, going back to what Jeff Snyder said about ingesting negative vs. positive streamwise vorticity in the updraft when talking about the dynamic pressure perturbation equation (something that I've only learned about in the last few months from class... awesome stuff if you ever get the chance to learn it), but is still not something I would like to see when looking at this forecast.
Something else to note about the wind profile is the clustering of members that have a backed surface wind (looking at the wind barbs on the skewT). This is an interesting trend that could be worth keeping an eye on, but based on the hodograph, the clustering of those members is relatively small compared to those with nearly straight southerly winds at the surface. Something else Jeff Dudda brought up that I didn't think about was the storm relative wind and the venting of precipitation. Looking at the SRWind v. Height plot below the hodograph (which uses the ensemble mean data), it's definitely suboptimal.
And this is only breaking it down for one SREF run at a single time step with very little discussion about what recent observations have been trending towards, and if the SREF is an accurate representation of what we're seeing right now. And I also didn't even talk about a single parameter... who needs parameters anyway? Perhaps I'll save my observation discussion for tomorrow - I think I've written enough for one night


