Kelton Halbert
EF1
I know there was a thread started on this last year, but given some new configurations and results from last year, I figured this would serve well as a new thread.
Some of you might remember from last year that there was an experimental model being run as part of the National Severe Storms Laboratory (NSSL) Hazardous Weather Testbed (HWT) known as MPAS, or the Model for Prediction Across Scales. This model is one of two in the final running to replace the GFS at NCEP (the other is FV3), and is being run once again this year to support the HWT. Below includes 1) the link to the model runs, 2) information about what makes MPAS different, 3) changes from last year. Hopefully this will serve as a reference point for those that decided to use/look at it this Spring.
If anyone has any questions regarding MPAS, it's configurations, or it's forecasts, I'd be more than happy to answer to the best of my ability. I think it's a really exciting new tool, and given how well it performed last year, look forward to seeing how it does this year as well. Please note that if you do go and attempt to see how it did with the events earlier last week, those forecasts were plagued with the bug in the PBL scheme and are not representative of realistic, physical forecasts. I am told, however, they will go back and rerun the data at some point.
Additionally, I will be working on bringing MPAS soundings back to SHARPpy once again. I'll be sure to let everyone know when it's up and going.
Happy forecasting!
Edit: One last thing... Taking a look at the 2m fields on the most recent run, there seems to still be some issues being worked out. Supposedly if things weren't fixed by tomorrow, they were going to revert to MYNN.
Some of you might remember from last year that there was an experimental model being run as part of the National Severe Storms Laboratory (NSSL) Hazardous Weather Testbed (HWT) known as MPAS, or the Model for Prediction Across Scales. This model is one of two in the final running to replace the GFS at NCEP (the other is FV3), and is being run once again this year to support the HWT. Below includes 1) the link to the model runs, 2) information about what makes MPAS different, 3) changes from last year. Hopefully this will serve as a reference point for those that decided to use/look at it this Spring.
- Highlights
Please note: much of this information is borrowed from last year's runs. While I do work with the folks running it, I'm not fully aware of all changes made to this years runs. As I come by new information, I will update these bits of info.
Link: http://www2.mmm.ucar.edu/imagearchive/mpas/images.php
Configurations: http://www2.mmm.ucar.edu/projects/mpas/Projects/MPAS_CONV_2016/
Initialization Times: Once daily at 00 UTC
Initialization Data: GFS
Forecast Hours: 120 (5 days)
Highest Horizontal Resolution: 3km
Lowest Horizontal Resolution: 15km
Vertical Levels: 55
Grid Points: 6.5 million
There are domain zooms for different parts of the U.S.
- What is MPAS and why is it different?
Much like the GFS, MPAS is a global model. However, that is where the similarities end. While the GFS works on a spectral grid that defines resolution in wave space, MPAS is a "physical grid" on the sphere, much like limited-area-domain WRF models (NAM, HRRR, the HiRes windows models, etc). MPAS is developed by the same folks at NCAR that developed the WRF-ARW.
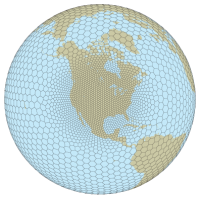
The primary feature of MPAS is that the model grid resolution is not static across the whole domain. The grid can be locally refined to a smaller resolution over a particular geographic area, allowing for the model to focus it's computing power on the areas of greater interest. It is believed that this gradual reduction in grid spacing, rather than static nested domains, reduced feedback errors in the model and could lead to overall better model performance. Additionally, the grid cells are hexagonal, with vectors calculated on the edges of the cell. Essentially what this means is that there are more "calculations" per grid cell than on a traditional rectangular grid. Despite higher computational costs, this leads to a higher "effective resolution" for the scale of features that can be resolved.
The primary feature of MPAS is that the model grid resolution is not static across the whole domain. The grid can be locally refined to a smaller resolution over a particular geographic area, allowing for the model to focus it's computing power on the areas of greater interest. It is believed that this gradual reduction in grid spacing, rather than static nested domains, reduced feedback errors in the model and could lead to overall better model performance. Additionally, the grid cells are hexagonal, with vectors calculated on the edges of the cell. Essentially what this means is that there are more "calculations" per grid cell than on a traditional rectangular grid. Despite higher computational costs, this leads to a higher "effective resolution" for the scale of features that can be resolved.
- Initial Results from Spring 2016
One of the goals of MPAS is to see if we can add any predictability to convective forecasts beyond 24-48 hours, which is one of the primary reasons MPAS is run 5 days out. My research involves looking into the convective predictability beyond Day 2, so I figured I would share an interesting case from last year. Keep in mind that some of the predictability may be attributed to the overall synoptic pattern of last May. Part of this year will be running a WRF counterpart and comparing the quality of the forecasts.
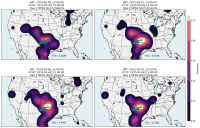
The verification compares observed storm reports and updraft helicity forecasts to create a "practically perfect forecast" and a "surrogate severe forecast", using UH greater than a specified threshold as a surrogate for severe weather. It is then gridded and processed in such a way that a "neighborhood probability" of seeing that UH value is calculated, and those are the probabilities plotted. The below image is one case (May 8 2015), comparing the Day 1 through Day 4 forecasts with the observed storm reports. The FSS number, or Fraction Skill Score, is a measure of how well the forecast did. As you can see, the FSS is similar or higher after Day 2 than it is on Day 1, indicating that there may be some good predictability beyond Day 2.
The verification compares observed storm reports and updraft helicity forecasts to create a "practically perfect forecast" and a "surrogate severe forecast", using UH greater than a specified threshold as a surrogate for severe weather. It is then gridded and processed in such a way that a "neighborhood probability" of seeing that UH value is calculated, and those are the probabilities plotted. The below image is one case (May 8 2015), comparing the Day 1 through Day 4 forecasts with the observed storm reports. The FSS number, or Fraction Skill Score, is a measure of how well the forecast did. As you can see, the FSS is similar or higher after Day 2 than it is on Day 1, indicating that there may be some good predictability beyond Day 2.
- Changes for 2016
The most notable changes in the 2016 runs will (hopefully) be the use of a different PBL physics scheme. Last year the MYNN scheme was used, which has some known biases. A better PBL scheme is being ported over from WRF, but initial testing of the new PBL scheme has not gone well. At this time, I am unsure if they have fixed the issues, or if they have reverted to MYNN.
The microphysics scheme has also been changed from WSM6 (from WRF) to Thompson microphysics for the new set of runs. I can't quite remember why this change is being made, but if I come by the information I will update it here.
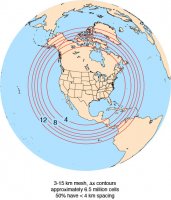
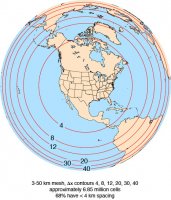
Lastly, the CONUS domain is slightly smaller in size but remains the same grid spacing. The grid spacing from outside the CONUS has been reduced from 50km in 2015 to 15km in 2016, and the transition zone of the grid is a little smaller.
2016 Grid

2015 Grid

The microphysics scheme has also been changed from WSM6 (from WRF) to Thompson microphysics for the new set of runs. I can't quite remember why this change is being made, but if I come by the information I will update it here.
Lastly, the CONUS domain is slightly smaller in size but remains the same grid spacing. The grid spacing from outside the CONUS has been reduced from 50km in 2015 to 15km in 2016, and the transition zone of the grid is a little smaller.
2016 Grid

2015 Grid

If anyone has any questions regarding MPAS, it's configurations, or it's forecasts, I'd be more than happy to answer to the best of my ability. I think it's a really exciting new tool, and given how well it performed last year, look forward to seeing how it does this year as well. Please note that if you do go and attempt to see how it did with the events earlier last week, those forecasts were plagued with the bug in the PBL scheme and are not representative of realistic, physical forecasts. I am told, however, they will go back and rerun the data at some point.
Additionally, I will be working on bringing MPAS soundings back to SHARPpy once again. I'll be sure to let everyone know when it's up and going.
Happy forecasting!
Edit: One last thing... Taking a look at the 2m fields on the most recent run, there seems to still be some issues being worked out. Supposedly if things weren't fixed by tomorrow, they were going to revert to MYNN.
Last edited:


