Dan Robinson
EF5
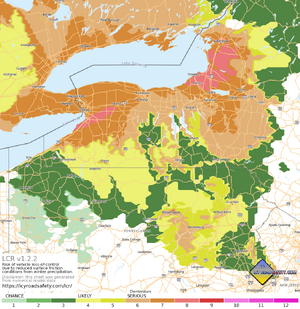
During the past couple of years, I have been working to develop a new winter weather parameter/scale focused on the risk of icy roads for drivers. The scale is an attempt to translate the conditions and impacts I've seen in the field over the past 2 decades into computer code.
After unsuccessful attempts to do it myself, I hired a programmer to get the concept into a working prototype. The first functioning script was released in November 2022, and I manually ran the script daily throughout that winter using NAM NEST and HRRR data. This process usually took between 30 minutes to an hour to run each day (mainly due to the size of model data downloads).
Last November (2023), I set up a server and again hired programmers to help me get an automated system going. This went online on December 4 and has been producing 6-hour LCR forecast charts every hour:
 icyroadsafety.com
The script produces both the LCR data and the BFP+ data set. BFP+ is a plot of all liquid-equivalent precip with different color scales for the surface temperature environment the precip is falling into.
I have designated the LCR script and process as open-source, available for anyone to download, tinker with and incorporate into their own model displays or graphics.
The parameter is a work-in-progress that I'm making updates and corrections to as each winter season progresses. The last big update was the release of version 1.2 last December that coincided with the launch of the server.
I posted this season recap video that shows the output from the LCR server through March 8.
The main site for LCR is as follows:
 icyroadsafety.com
That goes into the methodology of the script and has some tutorials on how to run it on your computer using Ubuntu Linux.
I would welcome any input and assistance from the weather community on improvements and further development.
After unsuccessful attempts to do it myself, I hired a programmer to get the concept into a working prototype. The first functioning script was released in November 2022, and I manually ran the script daily throughout that winter using NAM NEST and HRRR data. This process usually took between 30 minutes to an hour to run each day (mainly due to the size of model data downloads).
Last November (2023), I set up a server and again hired programmers to help me get an automated system going. This went online on December 4 and has been producing 6-hour LCR forecast charts every hour:
Icy Roads Forecasting and Monitoring Dashboard (LCR and BFP+ Charts)
Promoting safe driving in icy road conditions during winter weather.
The script produces both the LCR data and the BFP+ data set. BFP+ is a plot of all liquid-equivalent precip with different color scales for the surface temperature environment the precip is falling into.
I have designated the LCR script and process as open-source, available for anyone to download, tinker with and incorporate into their own model displays or graphics.
The parameter is a work-in-progress that I'm making updates and corrections to as each winter season progresses. The last big update was the release of version 1.2 last December that coincided with the launch of the server.
I posted this season recap video that shows the output from the LCR server through March 8.
The main site for LCR is as follows:
LCR (vehicle Loss-of-Control Risk): A new winter weather parameter and scale (v1.2.1)
Promoting safe driving in icy road conditions during winter weather.
That goes into the methodology of the script and has some tutorials on how to run it on your computer using Ubuntu Linux.
I would welcome any input and assistance from the weather community on improvements and further development.

