New Model Site: PivotalWeather

The only area I'd give COD an edge is load time on cell networks. I did some spot checks on tonight's 00Z NAM runs, and COD's 800x600 gifs ranged from about 50-100 Kb. Your 1100x850 pngs were in the 700-800 Kb range. I can definitely feel that difference on 4G when loading up a loop. I played around with converting the pngs to jpgs, and could get file sizes in the COD range with very minor image degradation. But I bet you guys have already thought through all this and have a good rationale for the current setup. Easy for me to suggest big changes to your rendering scheme :)
Stephen and others:

Just wanted to let you know that we've implemented compression on most of our images now, bringing file sizes down substantially. You shouldn't be seeing any image files over 500 KB, and the great majority should be under 300 KB. Hopefully this helps on slow and/or capped data connections!

We still have more exciting new features in the works that will hopefully be unveiled around the beginning of the year, as well.
 
Brett,
What is the difference between PW and HazWX? From what I can tell it looks like google maps and spc overlays, and upgradable premium ECMWF.
 
Brett,
What is the difference between PW and HazWX? From what I can tell it looks like google maps and spc overlays, and upgradable premium ECMWF.
Cody,

Right now, we are a free site supported strictly by ads, so there are a few differences. I'm not greatly familiar with HazWx, but I believe all their data is displayed within Google Maps, whereas ours are displayed as static images. There are pros and cons to both approaches; static images generally make moving around the site and viewing different maps snappier, where Google Maps can feel clunky at times.

As you mentioned, some pay sites like HazWx and WeatherBell are able to offer the full suite of ECMWF data, a data feed that's very pricy for a small startup. We hope to figure out a way to offer this too at some point in the future, though. For now, you can find the basic fields from the free data feed (MSLP, 500 mb heights, 850 mb temperature, etc.) on pivotalweather.

Hope you're enjoying the site, and let me know if you have any other questions!
 
Hi Brett. First thing, Absolutely fantastic website. Great work!

I have a really simple request brought on by having to re-calculate UTC in my head by an hour today. :p. Would it be possible to throw a UTC clock right on the page?
 
You have done an excellent job developing, this Brett. I have used your site numerous times over the past week and really like it. I use Weatherbell for the hi res Euro data, COD for their nice satellite data with overlays, and Earl’s pages for specific information, but this is now my “go to” site for other model data. I really like the Updraft Helicity pages (including the “accumulated” page in the HRRR set), the ability in “slideshow” to advance through the various panels, the county map overlays, and the quickly available sounding information. I would echo Michael’s suggestion that a running UTC clock would be helpful. Nice work!
 
Any chance of getting some update maps that show cities and roads (say like Google Maps) & I agree with the user above, have an option to change from UTC to whichever timezone you wish....

Sent from my SM-N920V using Stormtrack mobile app
 
Brett, just wanted to let you know that folks on a local weather forum here in the Philadelphia area also seem to increasingly use your site for winter weather analysis, including your snowfall forecast maps! I look forward to getting more immersed in your site as the severe weather season heats up and I start shaking the forecasting rust off ahead of my chase vacation!
 
Update: March 28, 2016

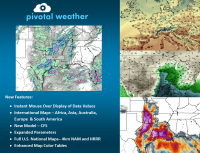
We just launched our first significant upgrade over the weekend. Here are some of the new features:

www.pivotalweather.com

- Data readout as you hover over maps
- International maps (covering each continent, plus some tighter zooms)
- Addition of CFS model output
- Expanded parameter list for most models (MLCAPE/MLCIN and more)
- CONUS maps for HRRR and 4km NAM
- Improved color tables

Hope everyone enjoys, and as always, feel free to leave any comments or requests here!

poster.png
 
Awesome work! Is there a way to have hover work with loops or is something in there not compatible?

Minor nit: Keyboard shortcut shows <> as moving forecast hours. I find that ,. do it.
 
Awesome work! Is there a way to have hover work with loops or is something in there not compatible?

Minor nit: Keyboard shortcut shows <> as moving forecast hours. I find that ,. do it.
Thanks! The hover feature is only available for static images, right now, due to bandwidth and speed concerns. We may do some more testing to see how feasible it would be to add it to loops.

Good catch on the keyboard shortcuts. The "<" and ">" keys should now work, too - although the intention was not to require a Shift key press for any of the hotkeys.
 
Being the old fart that I am, I generally dislike redesigns to websites that I utilize regularly, but I must say 'Bravo!' You have done a great job on the added features and your site is now even better. Big-league kudos.

Sent from my Nexus 6 using Stormtrack mobile app
 
Great work. One thing I have a question though. Prior, I was able to right click and save a model forecast image panel to my PC.
Now, I can't seem to do that. Was this changed? I really like be able to save 00 hr model analyses for posterity when a big event is
occurring/has just occurred!
 
Great work. One thing I have a question though. Prior, I was able to right click and save a model forecast image panel to my PC.
Now, I can't seem to do that. Was this changed? I really like be able to save 00 hr model analyses for posterity when a big event is
occurring/has just occurred!
Boris, which browser are you using? The HTML element which tracks the location of your mouse for soundings and data readout blocks the right-click functionality for the image in some browsers. However, you should still be able to right-click the top white portion of the image where the title, valid hour, etc. are printed, above the map area. Give that a try and let me know if it works.
 
Back
Top