That's a feasible hypothesis, but I'd like to make a few contrasting observations. The relatively early initiation and the radar appearance of the storms doesn't make me think that the cap was a significant problem. Typically, when we talk about capping, it's often in the context of "boom or bust" -- the cap either breaks or it doesn't. Of course, in the real world, it's a bit more complex, as large CINH even in absence of a prominent warm cap atop the boundary layer (such as is the case when the CINH profile is tall and skinny) can reduce updraft intensity (as some "energy" from the updraft is expended to lift the negatively-buoyant surface parcels through the CINH layer). However, after Wednesday's storms initiated, they never really looked to me like they were struggling with a cap. I didn't see any of the west-of-Lawton storms have a highly laminar low-level updraft that I've often seen when appreciable CINH is present. In addition, the radar evolution of the storms didn't really look like they were getting "munched by the cap" per se; the observations you made primarily were only seen with the low-level mesocyclone, which we know is very heavily affected by the structure of the low-level wind field. If it means anything, both the NAM and GFS initializations had ~0 j/kg CINH across the areas where the storms formed, so at least the models didn't analyze a cap. They both showed, however, very prominent S-shaped hodographs.
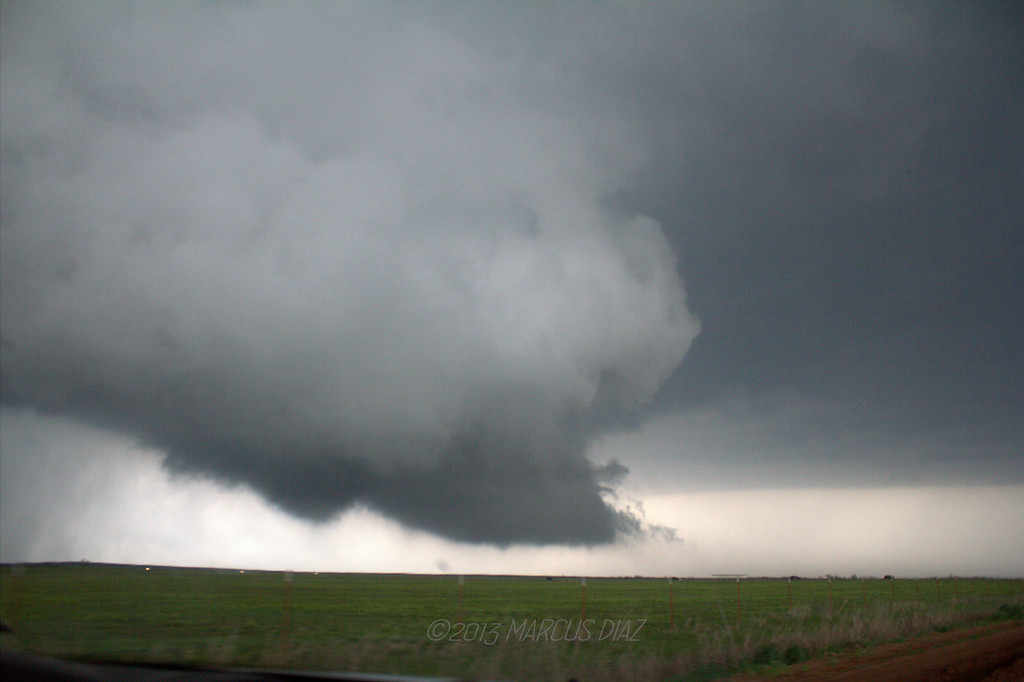
I think that is one of the big misconceptions about the cap when using it in the context of “boom or bust”, where if a storm doesn't fire it means that the cap was “too strong”, and if a storm does fire that the cap automatically just vanished and doesn't exist anymore. That layer of warm air aloft, unless it is cooled in some way, still exists and is ready to mess with any parcel that is not positively buoyant when it rises into that layer. Storms can still fire in regions where there is still CINH in the general area, if there is enough forcing via many different forcing mechanism to make one go up. Once a storm moves away from that forcing mechanism, if the meso is strong enough, it will still be able to periodically force parcels through that layer. This process of sometimes been able to force parcels through the layer and sometime not being able to is why you get cells that, at times, look crisp and very organized, and the next second look very fluffy, as they are starting to evaporate without any parcels rising into it.
Since you have been chasing for quite a while, I’m sure you have seen storms that have gone up, look very crisp, and you can see the rapid vertical motion in the updraft as parcels are streaming upward into the updraft. A few minutes later, the updraft is flurry, the core has weakened, and there isn't very much vertical motion observed in the updraft because parcels are not rising into it anymore. A few minutes later, as a few parcels are able to break through the cap again, intense vertical motion is observed again on a part of the updraft and it starts looking crisp yet again. This is a classic example of the cap trying to “pinch” off the storm throughout its life cycle. The storm never died during this process, but it was clearly been messed with the whole time. This process doesn’t always show up on radar, which is why visuals help out so much since radar cannot tell the whole story. Also, we know the models are good at analyzing some things and can be very bad at analyzing others. One thing the models have a problem with is underanalyzing CINH. I can’t tell you how many times the models, with the RAP being the most prolific offender, show there being 0 CINH, and yet no storms have fired and don’t for hours. Clearly, there must be some type of cap.
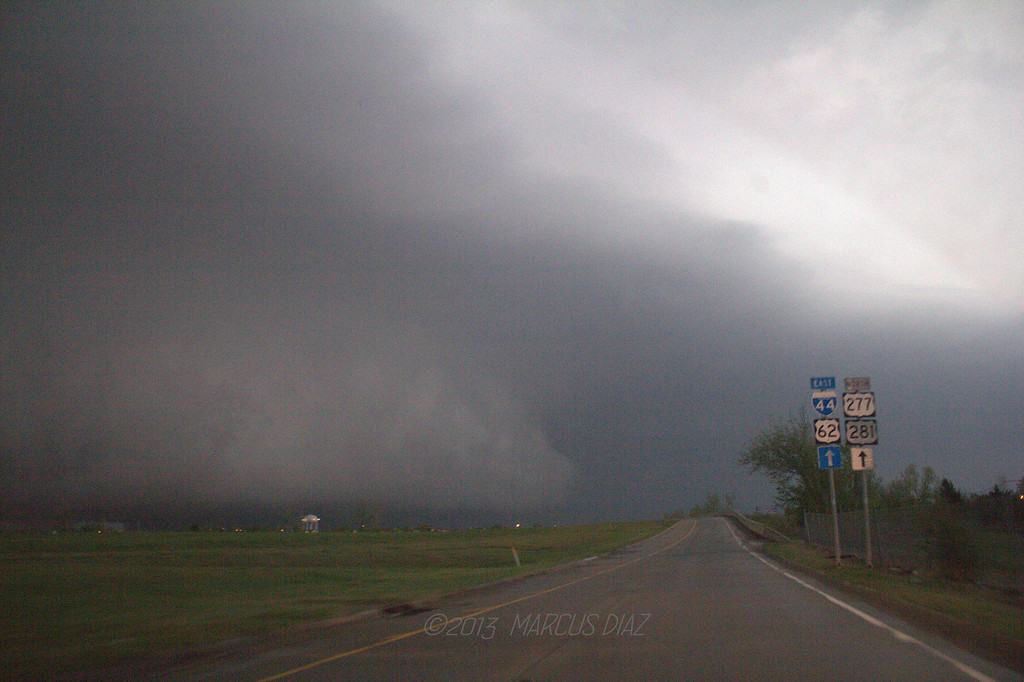
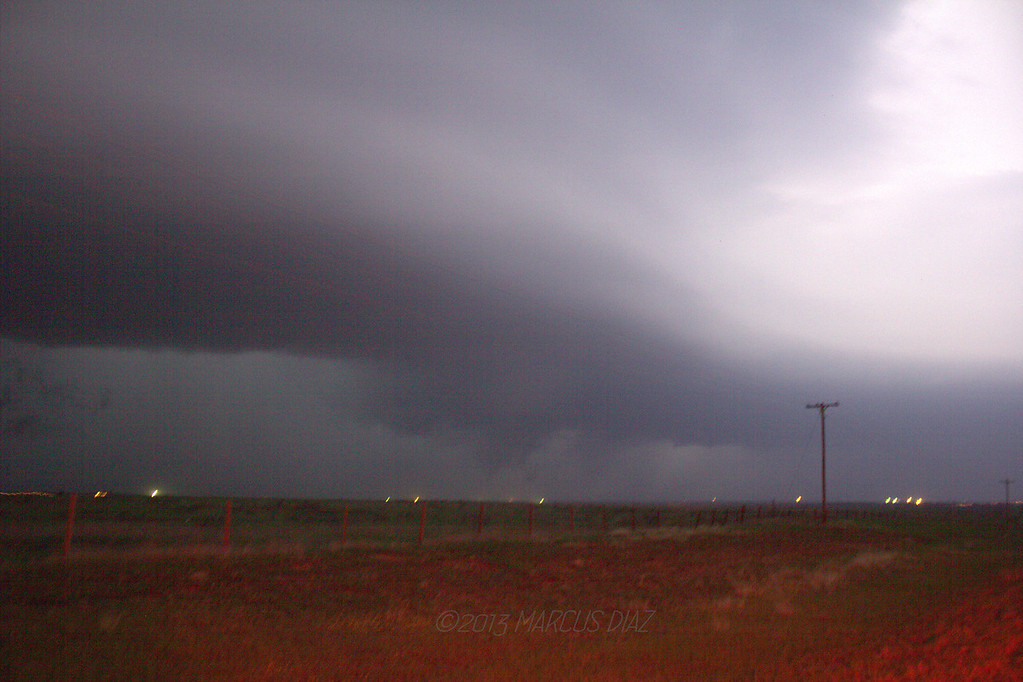
As far as this particular setup goes, I look at the 700mb analyzed map at 12z and 0z, and the soundings, to determine if there was indeed a cap or not, since I know models tend to underanalyze the cap. Looking at the 12z 700mb map, you can see the 700mb temp at OKC were 8 degrees C (high for this time of year), and the temps were even warmer to the south and west. There was SW 700mb flow that entire day in the area without any cold air advection going to move in, so if anything the temps in OKC, and in particular SW OK, could have even increased during that time. To see what kind of surface temperatures it would take to break that kind of cap and keep a sustained (not being pinched at all) updraft, I looked at the convection temperature at a site that closely resembled what the warm setup would be like with comparable moisture and comparable 700mb temps. This sounding would be DFW at 12z. The convective temperature at DFW was 91 degrees F. Now since the 700mb temps there were 11 degrees C and not the 10 degrees, which was being analyzed in SW OK, I shaved a few degrees off that convective temp and said the most optimistic convective temperature would be in the mid 80’s. The temperatures in that area, while the event was ongoing, were in the upper 70’s, with a few low 80’s sprinkled in near the Red River, per the NCAR surface map and OK Mesonet. Those temperatures were not what the convective temperature would be in that area and thus there was definitely CINH in the area. Whatever surface based parcels attempted to rise into that 700mb layer was going to have some issues. Storms were able to go up because there was strong enough convergence along that stationary front and some other N/S oriented boundary (possibly the edge of the 850 jet) that intersected the front that was showing up on radar, regardless of the CINH in that region. There was also some lift that arrived later on from the left exit region of a jet streak at 250mb that could have helped in keep storms sustained later on. Those cells were able to develop mesos that were strong enough to sustain themselves away from the original area of low level lift/convergence that caused them to break the cap in the first place, but they were still having problems sustaining a steady stream of surface based parcels into the updraft, since convective temperature in the area definitely was not reached. Thus, any parcel that was rising into the updraft would have negative buoyancy the second it hit that warm layer around 700mb. That negative buoyancy is something the mesos that day were going to have to fight their entire life cycle. That struggle was evident in the rapid fluctuations in the strength of the low level mesocyclone and the amount of rotation with it.
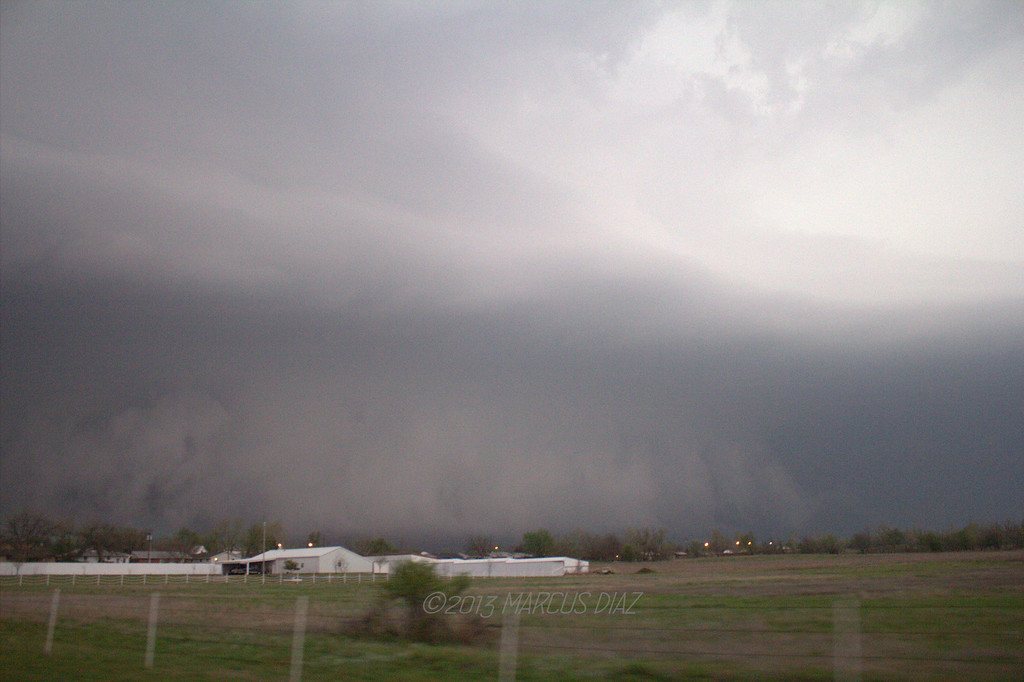
It's also possible that low-level CAPE was rather limited which, combined with a suboptimal low-level wind profile, could explain the messy low-level mesocylones. There were times when low-level rotation was strong, but I saw a lot of very lazy motion at cloud base, hinting that vertical motion and accelerations near cloud base weren't particularly strong.
Was the strong low level rotation and the lazy motion at cloud base you speak of occurring simultaneously? We saw “lazy motion” at the cloud base too, but that was when the rotation in the low level meso significantly dropped off and other features such as the tail cloud started to deteriorate, which is what gave us the indication that the cap was affecting the storm. Several times, when the first Frederick storm had a barrel, rapidly rotating meso and appeared to be ready to drop a huge tornado, the cloud base motion would definitely not be described as lazy at all.
We know that the low-level mesocyclone is strongly affected by the vertical perturbation pressure gradient force, since the tilting and stretching terms of the vertical vorticity equation are comparatively small in the very lower troposphere. The negative SRH near the 1-2 km layer would be problematic assuming updraft parcels were not exclusively limited to the 0-1 km layer. Indeed, if a parcel near 1.5 km AGL was ingested into the updraft, there would be a tendency for anticyclonic rotation instead of cyclonic rotation.
As far as the negative SRH in that layer, the relative small amount of negative SRH will get completely overwhelmed by the large amount of positive SRH that is being analyzed in the rest of the effective layer. Per the SPC RAP mesoscale analysis, the effective SRH in SW OK was 200 m2/s2 at 22z and increased 300 m2/s2 as 23z. Since the moisture and boundary layer was very deep in the region, the effective layer was around 750mb. This would encompass the 1.5km layer you described with the small negative SRH layer in it and still the helicity values strongly favored tornadic supercells, and in the case of 300 m2/s2…….strong/violent tornadoes.
I've chased a lot of days with s-shaped hodographs, and I almost always see these types of supercells with organized mesocyclones but very sloppy low-level mesocyclones. They also seem to be quite unsteady.
I have also chased many “S” shaped hodographs over the years too. I have been quite rewarded on some “S” shaped hodographs days, with the biggest winner and example of a very good day being March 28th, 2007. I remember the discussion about the “S” shaped hodographs that day also, and it turned out to be a huge outbreak. Pretty much if you chased that day and didn’t see a tornado you were extremely unlucky, as practically all the storms that formed that day produced a photogenic and/or large tornado. The warm sector was littered with “S” shaped hodographs that day, and it didn’t make one bit of a difference because the helicity values were still very sufficient for tornadic supercells. One big difference between that day and 04.17.2013……the strength of the cap. That warm layer aloft and the effects it can have on an updraft with the amount of negative buoyancy a parcel will have rising into that layer should not be underestimated. Many of the "S" shaped hodograph days recently that come to mind that weren't tornado producing machine, I think didn't produce because of the capping issues. This is where actually watching a storm while chasing it sheds so much light into what is really going on, as opposed to what the models are saying/forecasting should be happening with the errors that we know are in them.