Bunkers: Calculating Supercell Movement

Joined
Apr 16, 2004
Messages
1,613
Location
Austin, Tx
Recently started reading about calculating supercell movement via Bunkers method and trying to figure it out. I understand it generally, but probably need more detail and perhaps the right tools, charts to calculate it on. Any help for myself and others in similar need would be appreciated. What's the easiest way to do this?
 
Hi Bill. I can't anwer your question but this is within the realm of the subject of supercell movement.

What cause a supercell to right move?

Thanks in advance.
 
Recently started reading about calculating supercell movement via Bunkers method and trying to figure it out. I understand it generally, but probably need more detail and perhaps the right tools, charts to calculate it on. Any help for myself and others in similar need would be appreciated. What's the easiest way to do this?
[/b]

Bill,

Unless you're trying to produce some sort of gridded field, it might just be easier to do it graphically on a hodograph. By the way, the SPC mesoanalysis page plots the right Bunkers motion on the 0-3 km SRH graphic, and the Bunkers right and left supercell motion estimates are part of our sounding analysis display.

The technique itself is not too hard to reproduce by hand on a hodograph:

1. Estimate the 0-500 m mean wind and the 5500-6000 m mean wind on the hodograph.
2. Draw the shear vector from the low-level mean wind to the mid level mean wind. The simple sfc to 6km shear vector is okay to use, if you prefer a simplified approach.
3. Estimate the 0-6 km mean wind using the hodograph.
4. Draw a vector with a length of ~15 kt that begins at the 0-6 km mean wind and runs to the "right", perpidencular to the shear vector you sketched in 2.
5. The end point of step 4 gives you the Bunkers motion estimate.

Does my explanation make sense?

Rich T.
 
I have the ID (or Bunkers) method done up in python if you a looking for a numerical solution. A key to remember when calculating storm motion or mean winds, is consistency in the spacing b/w obs. Here's a link to my python method which uses another python module (it's got some comments)

ID Method

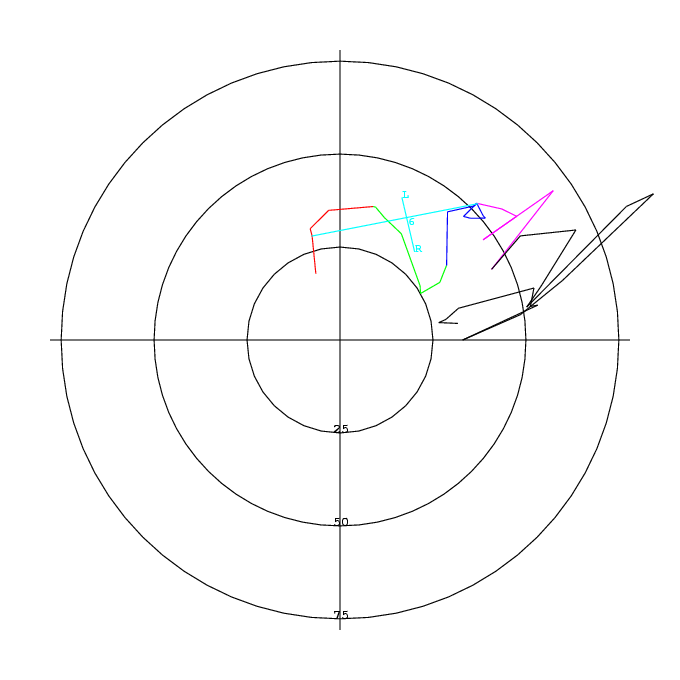
Here's the hodograph with the 0-6 km shear vector (the nearly horizontal cyan line), the 6 km mean wind plotted (6) and the L and R storm motions from Bunkers from KOUN990422. I tested my method on a sounding from the Bunkers et al paper and it worked!

hodograph.png
 
Hi Bill. I can't anwer your question but this is within the realm of the subject of supercell movement.

What cause a supercell to right move?

Thanks in advance.
[/b]

As I understand it, vertical shear leads to persistant rotating updraft, the rotating updraft accounts for about 50% of updraft strength and is enhanced along the flank. This enhanced updraft has a tendency to propagate to the right (or left for left turning) of the shear vector.
 
I have the ID (or Bunkers) method done up in python if you a looking for a numerical solution. A key to remember when calculating storm motion or mean winds, is consistency in the spacing b/w obs. Here's a link to my python method which uses another python module (it's got some comments)

ID Method

Here's the hodograph with the 0-6 km shear vector (the nearly horizontal cyan line), the 6 km mean wind plotted (6) and the L and R storm motions from Bunkers from KOUN990422. I tested my method on a sounding from the Bunkers et al paper and it worked!


[/b]

Kyle I downloaded and installed Python to Windows, but I've never used it. Do I have to compile your code first? Does your code and the called module have to be put in a library first to be accessed? What is the command to run your module?

Thanks, Bill
 
Unless you're trying to produce some sort of gridded field, it might just be easier to do it graphically on a hodograph. By the way, the SPC mesoanalysis page plots the right Bunkers motion on the 0-3 km SRH graphic, and the Bunkers right and left supercell motion estimates are part of our sounding analysis display.
[/b]

I hadn't realized that was storm motion for the wind field on the background of the mesoanalysis product. I'll keep that in mind as that is handy. That's pretty cool having that in the new sounding analysis as well. That will be something new to play with.

The technique itself is not too hard to reproduce by hand on a hodograph:

1. Estimate the 0-500 m mean wind and the 5500-6000 m mean wind on the hodograph.
2. Draw the shear vector from the low-level mean wind to the mid level mean wind. The simple sfc to 6km shear vector is okay to use, if you prefer a simplified approach.
3. Estimate the 0-6 km mean wind using the hodograph.
4. Draw a vector with a length of ~15 kt that begins at the 0-6 km mean wind and runs to the "right", perpidencular to the shear vector you sketched in 2.
5. The end point of step 4 gives you the Bunkers motion estimate.

Does my explanation make sense?
[/b]

Kind of. I think I need a good hodograph to work with. I need to find one and print it off or something. Without drawing each step it is a bit hard to visualize. Storm machine has forecast sounding and that's really what I want but I probably need something a bit more detailed than it. Thanks for the info.
 
Kyle I downloaded and installed Python to Windows, but I've never used it. Do I have to compile your code first? Does your code and the called module have to be put in a library first to be accessed? What is the command to run your module?

Thanks, Bill
[/b]

No, no compiling is necessary. Just feed in the bunkersmotion method with a wind direction list (meteorological degrees), wind speed list (any speed unit) and height list (m) (a note on this: I haven't been able to go in and do any error handling, so the lists need to go up to 6 km or the method will break). After that, it'll do it's thing. I don't know about the library thing....I haven't used Python that much on windows. The output will be the u and v components of the right and left movers which you can plot on a hodograph. I would let everyone see my code for the hodograph plotting and whatnot, but I am still working on all of it and it's a mess :unsure: If you want to use this though, send me a PM and I can go into a lot more detail.
 
are bunkers right values given the same way as the unit circle? ie straight east is 0/360, due north is 90, due south is 270?
 
Motion is given, as with all atmospheric vectors, based on N being 0/360, and the vector value being 'from', so a motion towards the east is given as being from the west, i.e. 270°.
 
Back
Top