5/22/10 DISC: SD

Good day all,

I also noticed a (possible) additional tornado that may be added. This was while the storm was just west of Bowdle, SD by a few miles, and crossing Highway 12 after 6:15 (around 6:23 to be exact).

bcpn0522.jpg


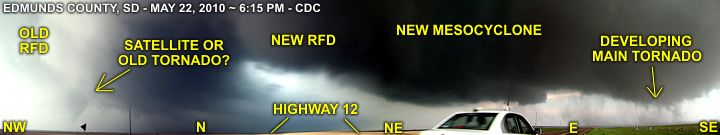
Above: Annotated diagram, grabbed from 4 video frames near 3:46 in the video, and put into a panorama and enhanced, a possible (satellite?) tornado can easily be seen to my NW. I had an idea this feature was there while filming (at the corner of my eye) but saw it in greater detail when I reviewed the video.

Note: In the video of this event, the link is repeated below, the composite (panorama) was grabbed from the HD frames near 3:46 in the video, where the pan from SE to NW shows the possible satellite / old meso / tornado. The directions are also annotated as well. This is also the same time the storm was "cycling" between the stove pipe / barrel tornado south of Highway 12 and the violent wedge that struck the northern fringes of Bowdle at about 6:30 PM and after.

http://www.youtube.com/watch?v=1OpxZkrd4oA

This is why we always keep our heads on a swivel in such violent storms rather than focusing on the main "event" (tornado).
 
Last edited by a moderator:
That must have come off the split that could be seen nw of the storm just prior to tornadogenisis. I sure never saw that or noticed at the time, but clearly recall the other base up in there well before that, which I think looked like a split on radar.

Edit: Heck it may not be the earlier split the more I think about timing and look at that.
 
Last edited by a moderator:
I'm sure it is unarguable that the radar data of this storm was incredible. One thing I noticed after I looked at archived level 2 data was the donut hole present during one of the later tornadoes. This was during the long-track EF-2 that crossed from Edmunds into McPherson County at around 0110 UTC. I made an animated gif showing this. The amazing thing is that I was able to use consecutive elevation scans, which were 14 to 18 seconds apart, to see the rotational motion in just the reflectivity. It's simply stunning!

01:13:54 UTC from KABR from 0.5 to 1.4 deg.

By the way, during that volume scan, I was able to find the following values:

0.5 deg. max G2G shear: 125.30 kts
0.5 deg. max delta-v: 165.12 kts
0.9 deg. max G2G shear: 126.27 kts
0.9 deg. max delta-v: 182.61 kts
1.4 deg. max G2G shear: 169.00 kts
1.4 deg. max delta-v: 173.86 kts

Also, the circulation was apparently large enough at 0.5 and 0.9 degrees that the azimuth of bins between the two that had the maximum delta-v had lower velocities suggesting that azimuth may have been in the middle of the circulation.
 
Last edited by a moderator:
http://www.crh.noaa.gov/images/abr/animation/Bowdle_Z.gif

Nice long loop there too. Amazing just how far right it turns right at and after Bowdle which you can see listed on there.

That's incredible to see a loop that long. I remember thinking during the first tornado that I was going to have trouble catching up as I was filming it from behind, but after turning right and slowing down significantly, I had no problems getting right up next to the Bowdle tornado. It's amazing the difference in speed between the first tornado - which is obviously moving much faster as it moved from far right to far left in my video screen in less than a minute, and the Bowdle tornado which was creeping along at maybe 10 mph.
 
That's incredible to see a loop that long. I remember thinking during the first tornado that I was going to have trouble catching up as I was filming it from behind, but after turning right and slowing down significantly, I had no problems getting right up next to the Bowdle tornado. It's amazing the difference in speed between the first tornado - which is obviously moving much faster as it moved from far right to far left in my video screen in less than a minute, and the Bowdle tornado which was creeping along at maybe 10 mph.


Yeah I remember thinking it was all still moving along at least decently as I pulled over north of Bowdle. I got delayed a bit after the close intercept west of Bowdle as the whole inside of my windshield was covered in water, as was my vid cam and still camera...and had to get them all wiped off. When I turned and went north of Bowdle it wasn't too far west of the highway yet and I thought, I'll just stop where I did cause it will be to my north soon anyway. It seemed like it was right there west of that highway out of Bowdle that it truly slowed down to essentially not going anywhere. Up through that whole time I kept thinking, this thing is moving along decently. Then it was like, this thing is never going to cross the highway north of Bowdle.
 
One other interesting aspect of this storm was the 700 mb temperature. It was 12 deg C. at 0Z per SPC.

http://www.spc.noaa.gov/exper/archive/events/100522/index.html

EF4 tornadoes rarely occur at 700 temps above 12.

Per Matthew Bunkers, John R. Wetenkamp and Jeffrey J.Schield
article ( Out of the NWS Rapid City, SD office)

Observations of the Relationship between 700-mb Temperatures and Severe Weather Reports across the Contiguous United States

http://www.crh.noaa.gov/images/unr/soo/700mb/Bunkers-Wetenkamp-Schild_2009_WAF_ver1.pdf

In fact, during the study period between 1993 to 2006..there was no F4 or F5 reports with 700 temps above 12. Taking it one step further, less than 5% of all the tornadoes in the country occurred with 700 temps above 12.

In this scenario, with the temps right at 12; clearly this storm had something extra going for it to make it happen.

With dewpoints of at least 75 under the initial updraft that I measured, the convergence at the triple point, and great venting of the updraft that was apparant per later SAT pics I'm sure all had a part in this.
 
I believe the OFB from the morning convection over northeast SD was also a key to getting the storms going as well.
 
Back
Top