gdlewen
EF4
This is a more-or-less "Weather in the News" post, but since it covers an event in the past 24 hours...it could go here.
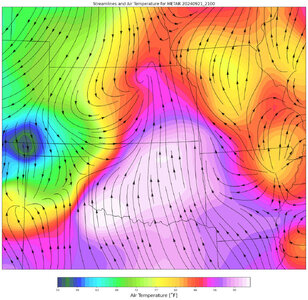
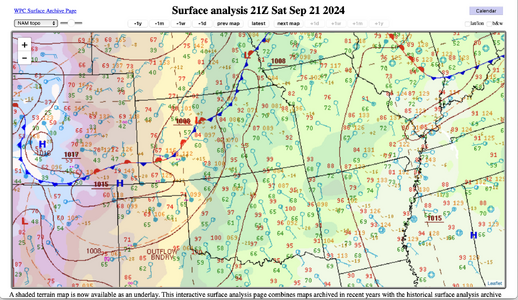
My wife follows a guy who has a Facebook Page titled "Weather Watch Oklahoma", and she told me how he described a mesoscale cold front associated with Saturday's afternoon convection in the Panhandles. I checked it out and it was pretty dramatic:
"A vague disclaimer is nobody's friend": the streamlines depicted here are actually streamlines of the specific humidity current, which I find are often helpful in delineating outflow boundaries.
Note: Barnes or Cressman smoothing interpolators are not used for this analysis--certainly not if it can be helped. For one thing, I have trouble getting those methods to work, and often want to reanalyze the data by hand after using them. For another thing: philosophically, I have trouble getting past the violation of causality implied by using downstream data to "smooth" upstream data. Therefore, the smoothing interpolators I use here attempt to fit a surface to the data (this is where the "smoothing" takes place), and then interpolates that surface to a grid. For the streamlines this pays a definite dividend: for example, convergence lines are tightened up appreciably. For the temperature contours? Not so much.


