gdlewen
EF4
TL,DR: What are the criteria used by WPC for drawing fronts?
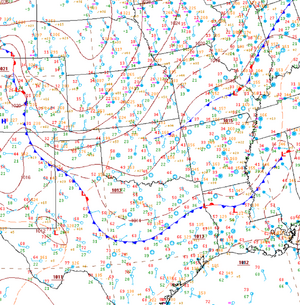
Last week, the local media forecasters in Tulsa were all talking about an approaching cold front, which would bring in the second arctic air mass in less than a week. As the front passed, the various text OKC/TUL discussions all talked about the cold frontal passage and the new new cold wave. But, when you look at the 00Z WPC surface analysis for January 19, 2024, all you see is a cold front in south-central Texas, which is (more or less) the boundary left over from the previous weekend’s cold air outbreak:

Looking at the plotted station data in Figure 1, you can see something like a 10˚ temperature drop in central Kansas, so that seems to indicate the position of the front they’re talking about. Aside from a jump in windspeeds, no other features besides the temperature discontinuity really jump out. So, I guess this qualifies as a “secondary cold front”. Now, I do recall that at some point after I took my meteorology courses, the primary criterion for locating fronts at the surface shifted to “first order discontinuity in potential temperature”, so I looked at the 20240119 00Z F0 RAP model output to see what’s up.
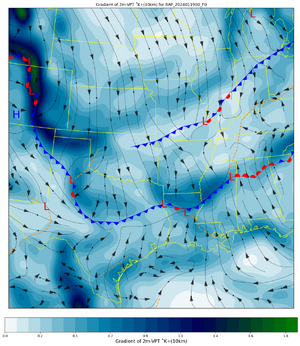
The following figure is a plot of the gradient in Virtual Potential Temperature (VPT). I mostly use plots like this to assess the strength of dry-lines (therefore dividing by 10km to match values reported in the dry-line literature), but it can also work for fronts:

Figure 2. Contour plot of Absolute Value of the Gradient in Virtual Potential Temperature and streamlines of surface wind for RAP 20240119 00Z F00 model output. WPC Surface Analysis features added using standard notation, and MetPy routines were used to render the WPC text product to plot the frontal positions.
You can see the analysis follows the maximum VPT gradient (more or less) and this suggests the WPC analysts are looking at something like Figure 2 when they do their analysis. Except that, here, the area of the temperature gradient in KS (e.g. secondary cold front) is well-indicated in the gradient plot but no front is analyzed by the WPC...so...maybe they don’t use something like this in their analysis. [Note that the front across NE OK-MO-IL-IN is undergoing frontolysis (see Figure 1). This front, lying in a region of weak VPT-gradient, is a feature that exists in one form or another throughout the event.]
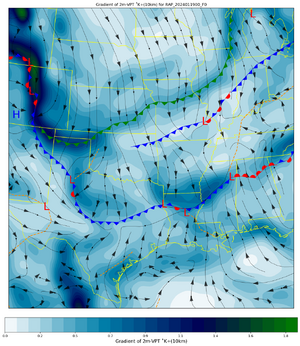
If you use the gradient plot as a guide to "add" in the secondary cold front, you get Figure 3:

Figure 3. Similar to Figure 2. WPC frontal analysis in standard notation, and MetPy routines were used to render the WPC text product to frontal positions. Secondary cold front position, based on VPT gradient analysis, is in green.
All this work is just to set up my question because I really think it’s important to do as much homework as is possible before asking busy people for help:
“What criteria does the WPC use for surface analysis of fronts? No secondary cold front was ever analyzed for the event, but various weather discussions--text and media--all proceeded under the assumption that the front existed. And when it went through, we knew it.”
Unified Surface Analysis Manual
Thomas, Carl M., and David M. Schultz. "What are the best thermodynamic quantity and function to define a front in gridded model output?" Bulletin of the American Meteorological Society 100.5 (2019): 873-895.
Note: there are lots and lots more sources in the literature and I think it's kinda fun to read how the historical debate over what is and what is not a front has progressed over the past century. But, still....
Last week, the local media forecasters in Tulsa were all talking about an approaching cold front, which would bring in the second arctic air mass in less than a week. As the front passed, the various text OKC/TUL discussions all talked about the cold frontal passage and the new new cold wave. But, when you look at the 00Z WPC surface analysis for January 19, 2024, all you see is a cold front in south-central Texas, which is (more or less) the boundary left over from the previous weekend’s cold air outbreak:

Figure 1. 00Z WPC Surface Analysis for January 19, 2024.
Looking at the plotted station data in Figure 1, you can see something like a 10˚ temperature drop in central Kansas, so that seems to indicate the position of the front they’re talking about. Aside from a jump in windspeeds, no other features besides the temperature discontinuity really jump out. So, I guess this qualifies as a “secondary cold front”. Now, I do recall that at some point after I took my meteorology courses, the primary criterion for locating fronts at the surface shifted to “first order discontinuity in potential temperature”, so I looked at the 20240119 00Z F0 RAP model output to see what’s up.
The following figure is a plot of the gradient in Virtual Potential Temperature (VPT). I mostly use plots like this to assess the strength of dry-lines (therefore dividing by 10km to match values reported in the dry-line literature), but it can also work for fronts:

Figure 2. Contour plot of Absolute Value of the Gradient in Virtual Potential Temperature and streamlines of surface wind for RAP 20240119 00Z F00 model output. WPC Surface Analysis features added using standard notation, and MetPy routines were used to render the WPC text product to plot the frontal positions.
You can see the analysis follows the maximum VPT gradient (more or less) and this suggests the WPC analysts are looking at something like Figure 2 when they do their analysis. Except that, here, the area of the temperature gradient in KS (e.g. secondary cold front) is well-indicated in the gradient plot but no front is analyzed by the WPC...so...maybe they don’t use something like this in their analysis. [Note that the front across NE OK-MO-IL-IN is undergoing frontolysis (see Figure 1). This front, lying in a region of weak VPT-gradient, is a feature that exists in one form or another throughout the event.]
If you use the gradient plot as a guide to "add" in the secondary cold front, you get Figure 3:

Figure 3. Similar to Figure 2. WPC frontal analysis in standard notation, and MetPy routines were used to render the WPC text product to frontal positions. Secondary cold front position, based on VPT gradient analysis, is in green.
All this work is just to set up my question because I really think it’s important to do as much homework as is possible before asking busy people for help:
“What criteria does the WPC use for surface analysis of fronts? No secondary cold front was ever analyzed for the event, but various weather discussions--text and media--all proceeded under the assumption that the front existed. And when it went through, we knew it.”
Some References:
From the WPC:Unified Surface Analysis Manual
Thomas, Carl M., and David M. Schultz. "What are the best thermodynamic quantity and function to define a front in gridded model output?" Bulletin of the American Meteorological Society 100.5 (2019): 873-895.
Note: there are lots and lots more sources in the literature and I think it's kinda fun to read how the historical debate over what is and what is not a front has progressed over the past century. But, still....
