Question: Finding Cold Anafrontal Surface Aloft

gdlewen

EF3
Joined
May 5, 2019
Messages
202
Location
Owasso, OK
Following is a fairly detailed question, but I think it's more of a question from a weather enthusiast who chases, and not relevant to the science of chasing, so I think it belongs here. Note: I can’t ask this of my colleagues in the Physics community, who will likely respond with the digital equivalent of a pat on the back and, “If you say so, Geoff.” Nor do I want to post this to reddit because the signal-to noise ratio there can be quite low. (I have more confidence in the denizens of StormTrack.)

Question: What unique analytical criteria do professional meteorologists use to identify cold anafrontal surfaces aloft?
  • Unique is a keyword by which I mean "associated with a vertical transition from a polar air mass on the ground to a non-polar air mass aloft". Therefore, EML-type transitions are excluded (besides, EML look more katafrontal anyway, so...no.)
  • Analytical is intended to differentiate from learned pattern recognition: a computed variable or composite index.
For example, it doesn’t take seeing too many examples of cold anafrontal soundings to recognize them in the future. From there you can make a graphical estimate (visually) of the air mass transition. But I'm not looking for that: If you had to compute a variable or composite index to automatically identify a sounding profile as “cold anafrontal”, and calculate the height of the frontal transition zone without looking at it, what would you do? There must be an automated process for this.

Here’s an example, taken from the extreme cold event of February, 2021. Two soundings from February 11, 2021 at 12Z for OUN and FWD. For OUN, the method I’m using seems to have found a reasonable estimate of the frontal surface height (based on the winds profile), but for FWD, it looks to be too high.

Ana_OUN_FWD.jpg

What's the best method for doing this automatically? Thank's all!
 
If I'm understanding the question correctly, you're looking to be able to automatically flag soundings with similar profiles? As far as I know, no strict criteria have been established for doing this automatically, but using the physics we know about anafrontal lifting we can make some rules of thumb. I think the method you've outlined is on the right track. Anafrontal soundings are usually categorized by very large positive lapse rates in the lowest several km. They also typically have higher relative humidity with warm and moist air riding up along and behind the frontal surface. If I were writing code to categorize soundings I would do the following:
  • Iterate over the lowest 6km of the sounding and check the lapse rate (change in temperature over height) in increments of 50 or 100 mb. Using the profiles you provided we should see very large positive lapse rates (on the order of 10-15 k/100 mb) through about 3 km.
  • Once the lapse rate switches to neutral or negative that would mark the effective top of the frontal surface.
  • Like your method I'd also do a wind direction check to refine the top further.
  • Id also check the relative humidity in each layer is above a certain threshold, maybe 80%? Once RH begins to decrease you've usually move into a separate air mass above the front and it can serve as a final check.
Hopefully that gets you started.
Thank you--this helps a lot. I appreciate the quick and thoughtful response: there's a lot here to unpack but I have no doubt this process will result in a BIG improvement.
 
If I'm understanding the question correctly, you're looking to be able to automatically flag soundings with similar profiles? As far as I know, no strict criteria have been established for doing this automatically, but using the
Hopefully that gets you started.
@adlyons I thought I'd give you an update on my progress following your helpful comments. I could do this via a DM but just in case anyone else is interested in this thread, it seems reasonable to post them here. (It could happen.)

The example I gave in the OP--for a record-setting cold air outbreak--was deliberately chosen on the extreme end of the spectrum of frontal profiles so it would be unambiguously cold anafrontal. It made the presentation of the problem a bit more straightforward.

But that's also a problem because most fronts lie away from the extremes: cold katafronts, anafronts in transition to katafronts, etc. The question of "Where is the PBL?" also factors into the analysis. I am finding many papers add in spatial information to 'cess out the position of the front: for instance using cross-sections to find the position of the front aloft. Since I am trying to use single-station analysis--i.e. deliberately excluding the spatial context of the sounding--I am still struggling.

Here is a comparison of several methods--you can see I took your advice to heart.
  • Temperature Lapse Rate Analysis
  • Mixing Height (for PBL)
  • Inflections in Theta-E
  • Transitions in Winds Aloft
  • Humidity Analysis
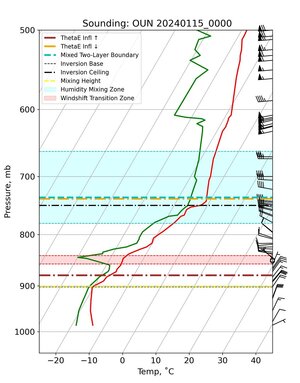
For humidity analysis, I use a two-layer model assuming well-mixed layers with a mixing zone between them. The model is then analyzed to find the boundary between the layers. (I have seen this sort of model used in other contexts, and resorted to the additional complexity as a last resort.) This approach forces an abstraction over confounding details in the case of sounding profiles with multiple moist and dry layers interleaved.) Following is the 00Z sounding for OUN January 15, 2024:

FindCF_OUN_20240115_00.jpg

There's a lot here, including a broad humidity mixing zone between the two air masses, but basically we can see the various method results cluster around two layers:
  • what appears to be the PBL near 1km AGL (average 881mb ± 21mb), and
  • what appears to be the cold anafrontal zone near 2.5km AGL(average 734mb ± 6mb).
On January 15, 2024, the front had advanced well beyond OUN into south TX, so it does make sense the frontal boundary aloft would be found at heights of 2-3 km AGL, does not?

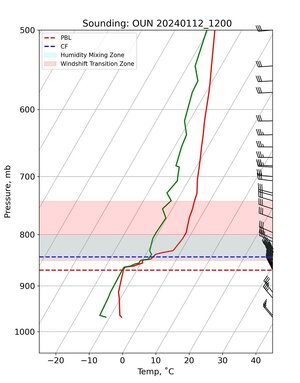
I applied the same methodology to the OUN sounding just after frontal passage (1/12/2024 12Z), and the frontal boundary seems to be difficult to separate from the PBL. However, the average levels (PBL at 868mb ±12mb and CF at 842mb ± 30mb) seem to make sense:

FindCF_OUN_20240112_12a.jpg

To summarize, I think you gave me the right advice, but it's still a work in progress. Now that you have seen this: any further thoughts? (Many Thanks)
 
Here's an update for the interested on ST. [Aside: I was hoping for an elegant solution because I like less "brute" in my "brute force".] But brute force it is.

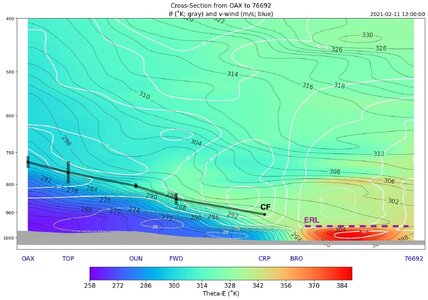
In the figure below is plotted a N-S cross section through Norman on February 11, 2021 at 12Z. The preliminary cold frontal surface represented as a heavy black line, including error bars representing the standard deviation of several methods being tested. Each sounding was analyzed in isolation for the estimate of the frontal surface aloft.


Xsctn_20210211_12Z_OAX to 76692_ThetaE_CFA.jpg

A few points which need to be challenged if they are wrong:
  • In every case, the analyzed surface lies above the wind-shift layer (approximately zero isotach of v-component of wind)
  • The analyzed surface lies above the peak gradient in potential temperature.
  • There is an ERL (elevated residual layer) over S-TX and NE-MX, but I don't know enough tropical meteorology to say if this is the trade wind inversion or not. It gets classified as an ERL, so....
I would say that, so far, this is "an estimate", and not a very satisfactory one. Still lots of work to be done.


P.S. In the figure above I really don't trust the machine analysis of the potential temperature gradient as an indicator of the frontal surface. Matplotlib thinks it's OK to interpolate across discontinuities, and tends to smear out gradients. (I actually don't know of an interpolator that does identify and respect discontinuities like frontal surfaces, so when I really care about the details, I still hand-analyze. So--a good interpolator that can handle discontinuities would be a great help if anyone knows one.)
 
Back
Top