• A friendly and periodic reminder of the rules we use for fostering high SNR and quality conversation and interaction at Stormtrack: Forum rules

    P.S. - Nothing specific happened to prompt this message! No one is in trouble, there are no flame wars in effect, nor any inappropriate conversation ongoing. This is being posted sitewide as a casual refresher.

2023-07-17 EVENT: KS/OK

gdlewen

EF2
Joined
May 5, 2019
Messages
191
Location
Owasso, OK
I'm opening this event thread to discuss the supercell formation yesterday, July 17, 2023, NE of DDC. This could be part of a discussion following @Mike Smith 's post on the NWS-DDC ( Dodge City NWS and the Astonishing Decision Not to Issue a Tornado Warning Earlier today ), but I want to focus on the process of anticipating convective initiation.

I am hoping to gain some insight into the "orders of magnitude" in factors relevant to convective initiation in situations like yesterday afternoon. There were no "non-synoptic soundings" in the area, and the NAM 3km showed weak capping. A weak cold front was draped over central KS just south of I-70, but air mass contrast across the boundary was fairly low.

Convective temperatures were at or below the observed temperatures in the region, and MLCAPE values were on the order of 4000-5000 J/kg. At the same time, MLCIN values were low: on the order of 0 to -5 J/kg. Here's a screen shot of the CoD NAM 3km MLCAPE/MLCIN for 20Z yesterday:
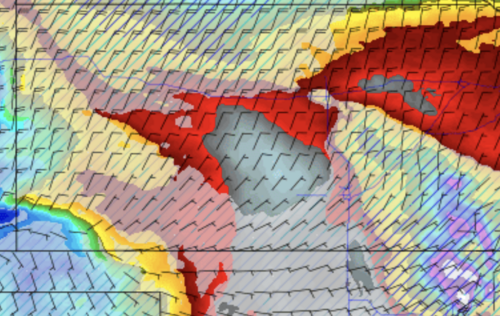
1689690526014.png

The NAM 3km model did predict discrete supercell formation in the range 20-21Z in the area. This area was on the western margin of the SPC SLGT risk polygon.

At about 315PM CDT (2015Z), a collision of two boundaries initiated convection, which quickly became severe:

View attachment KDDC_20230717_2114.mov


From reading @Mike Smith 's blog post (c.f. above link), it seems he predicted the threat, but it wasn't until MCD#1601, issued nearly 30 minutes later, that the threat was acknowledged by SPC. The SPC forecasters mentioned, "The cap has been breached across south-central KS, with explosive development recently noted with a supercell...", and then went on to delineate all the factors that would make any convection that managed to develop potentially severe.

Finally, my question: Given the weak capping and conditions favoring severe convection in the area should it develop, what goes into the decision to issue a MCD or weather watch. In other words, what information did the forecasters at DDC or SPC have that inhibited them from issuing any guidance until after the fact? This is not a complaint, nor an attempt to malign anyone, but rather an attempt to reason from incomplete information. It's pretty obvious they have access to far more information than has the general public...what subtle factors were at play here?
 
Geoff,

As you requested yesterday evening that I provide some insight into my thinking, here it is.

First, what I did not do: look at the synoptic models or CAMs with the exception of the HRRR (which didn't forecast much). I have found the methods I've used for 50 years work just fine for forecasts in the 0-3 hour range.

Here is the process I use and I always do them in the same order so anomalies stick out:
  • I do an enhanced surface chart that uses satellite data to locate boundaries. There was a surface low, warm front, and dry line along the north and west edges of my threat area. The dry line was still moving east at that point.
  • Is the pressure falling? Yes, it was yesterday -- and fast. 3mb in two hours. That indicated the possibility the dry line might continue east (it didn't), thus taking my threat area past ICT. The other reason was TCU along the warm front that would move SSE if they fired.
  • Moisture convergence and deep moisture convergence over the threat area? Yes.
  • 500mb height falls. Yes.
  • Surface CAPE was off the chart at 7,000 and uncapped. Normalized CAPE was .45 which mean that an updraft with that much CAPE might actually be sustained. The uncapped CAPE extended to the Flint Hills, thus the eastern edge of my threat area. The peak downdraft CAPE was 1,300 which was adequate for ~65 mph. If the dCAPE had be stronger, I would have forecast higher winds. As it turned out, there power poles snapped SE of DDC.
  • Bulk shear was adequate. Effective SRH was 200+ which is adequate for tornadoes.
  • The SIGTOR was surprisingly high -- at 4 in the area where the supercell fired and 5 farther SE.
  • Hail parameter was 4+.
So, all of this was rather straightforward. However, I busted other than the single tornado-producing supercell.

Of course, if I were making a longer-term forecast (beyond 6 hours), I would have consulted the 3km NAM (usually the best of the CAMs) and FV3. More and more, I've come to believe that "less is more" when it comes to models.

If there are any questions, please let me know.

Thanks for asking.

Mike
 
Last edited:
Moisture convergence and deep moisture convergence over the threat area? Yes.

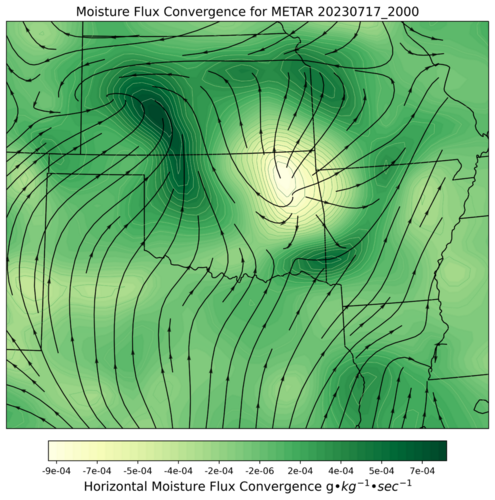
Oh my. I didn't even check moisture flux convergence since I wasn't chasing that day. Is this anything similar to what you saw? This is the 20Z surface analysis, so it precedes storm development by 20-30 minutes or so (assuming reports are made in the 10 minutes or so prior to the hour) and thus conditions are uncontaminated by the developing cell.

MFC_METAR_20230717_2000_20230718_1417.png
 
Oh my. I didn't even check moisture flux convergence since I wasn't chasing that day. Is this anything similar to what you saw? This is the 20Z surface analysis, so it precedes storm development by 20-30 minutes or so (assuming reports are made in the 10 minutes or so prior to the hour) and thus conditions are uncontaminated by the developing cell.

Yes, almost exactly. That is why I do it the same way every single time. It makes it less likely to miss something.

I've studied "human factors" a lot and found that the FAA's air traffic controllers make less than one error for every billion (yes, billion!) plane interaction. One of the things they found was that it was absolutely vital to implement best practices and do it the same way every time. I applied that to meteorology. Some of my employees were far less than thrilled as many meteorologists looked at themselves as artists rather than scientists. But, the ones that got with the program because it allows mets to make outstanding forecasts and warnings.

And, isn't that why were are here?
 
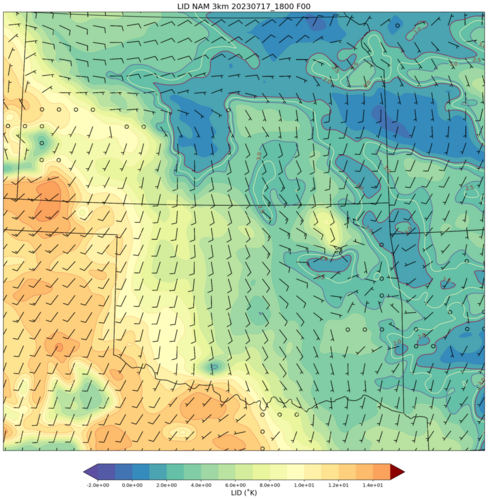
Not sure how much interest there is in this thread at this point, but just for the sake of being thorough, I ran the LID calculation for the 18Z NAM-3km model (that is: Carlson, et.al LID definition--from their papers on LSI.) In the area of convective initiation, including the path the cell followed, capping was noticeably weaker.

NAM3km_LID_20230717_1800_F00_20230719_0942.png
 
Oh my. I didn't even check moisture flux convergence since I wasn't chasing that day. Is this anything similar to what you saw? This is the 20Z surface analysis, so it precedes storm development by 20-30 minutes or so (assuming reports are made in the 10 minutes or so prior to the hour) and thus conditions are uncontaminated by the developing cell.

View attachment 24112

The SPC mesoanalysis page includes moisture convergence. What are some other sources? Is “horizontal moisture flux convergence“ different than “moisture convergence,” and if so, how?
 
The SPC mesoanalysis page includes moisture convergence. What are some other sources? Is “horizontal moisture flux convergence“ different than “moisture convergence,” and if so, how?
I am sure they are the same thing. I really have a hard time using the SPC mesoanalysis graphics page because I think the displays are optimized for larger screens than I am using. (Obviously I cannot know this.) When I am chasing I use what's on the web.

My calculations are based on a paper by Banaczos and Shultz: https://www.spc.noaa.gov/publications/banacos/mfc-waf.pdf

The reason to "do it myself" is primarily as a learning exercise. Once I got out of school I needed a method to regularize my learning...I am not one to read papers without a purpose so every chase, every "project", is used as a platform to extend what I know.

But also because I can configure the analysis as I see fit: add streamlines, change the colormap. Etc. Etc. Humans are very much visually-oriented, so using filled contours in the MFC display allows the viewer to immediately recognize the divergence in the wake of the MCS that moved through Tulsa earlier that day. Adding streamlines only makes it more obvious.

It will never be as good as what the professionals are putting out, but again: the goal is to learn.
 
Last edited:
Yes, almost exactly. That is why I do it the same way every single time. It makes it less likely to miss something.

I've studied "human factors" a lot and found that the FAA's air traffic controllers make less than one error for every billion (yes, billion!) plane interaction. One of the things they found was that it was absolutely vital to implement best practices and do it the same way every time. I applied that to meteorology. Some of my employees were far less than thrilled as many meteorologists looked at themselves as artists rather than scientists. But, the ones that got with the program because it allows mets to make outstanding forecasts and warnings.

And, isn't that why were are here?
Im in nuclear power and we use "human performance tools" extensively.
 
I also work in Nuke and can confirm the abundance of procedures and HU Tools, but they're there for a reason. We jokingly says that STAR means S**t That Ain't Right, or Supervisors Take All Responsibility. The supervisors don't find that as humourous, lol.

I'm still learning the basics of forecasting, but I can definitely see the benefit of finding a consistent way of looking at the data. Thanks for the checklist Mike.
 
Back
Top