• While Stormtrack has discontinued its hosting of SpotterNetwork support on the forums, keep in mind that support for SpotterNetwork issues is available by emailing [email protected].

Why "Steep" Lapse Rates

Joined
Oct 14, 2008
Messages
300
Location
Lake Tahoe, CA
I was just wondering why higher lapse rate values are referred to as "steep"? I have a couple pet theories, but I never really seen that explained anywhere. Does anyone know?
 
Very unscientific explanation: lapse rates are the rate in which temperature decreases going up in height. Thus the higher values are a faster rate of decrease. So if you represented that with a graph, your line would thus have a "steeper" curve as you increased your value. Hopefully that makes some sense.


Sent from my iPhone using Stormtrack mobile app
 
Yes, I see that if you represent it on a graph it would appear steeper. I was thinking about it as it appears on the Skew-T. Strange because we always look at the Skew-T to visualize the environmental lapse rates. On Skew-Ts "steep" lapse rates actually appear to have a more shallow slope than below normal (6.5 C/km) lapse rates.
 
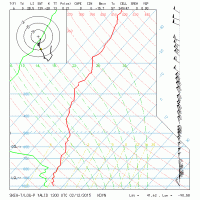
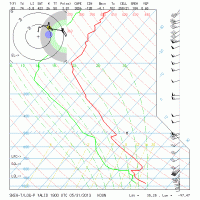
I think the confusion stems from how the Skew-T is constructed versus what we typically think of as a steep slope on a tradition x-y graph. The Skew-T has the temperatures skewed, as a result it reads slightly differently. A steep lapse rate on a sounding is one that decreases rapidly with height -- slopes strongly from bottom right to top left on the sounding. A stable sounding with poor lapse rates, for severe weather, would tend to look more steep in the traditional sense in that they go more vertical ("steep" on an x-y graph) on the sounding.

An example of steep lapse rates. Multiple layers with temperatures rapidly decreasing with height:
e8e0b00fbe1abd2030c018fa677d423b.gif

Stable profile/poor lapse rates. Notice how if you move from the surface to 900 mb, the temperature of the profile doesn't change much.:
4164c5ae69ab89f3fa3fd3c87b5e8616.gif
 
Perhaps a little more background related to the physics. If the lapse rate is steep, then the size of the temperature gap between the parcel of freely rising air and the environment will be larger, because the parcel follows the set moist adiabatic line and not the sounding line. This is important for 2 factors. #1, the larger the difference, the faster the speed of the rising parcel and hence faster updraft. #2, the larger the gap, the longer it takes for the parcel to hit equilibrium, generally, so a longer updraft and higher top.

Both of these will increase the overall CAPE, (which is the area between the moist adiabatic line and the sounding. Low level lapse rates are key to supercells, as a steep low level lapse rate will provide the best updraft in the shear-bearing section of the storm below 3km, making for the highest enhanced helicity index. (which is factor of helicity and cape). Poor lapse rates at low levels are often related to 'caps' due to dry air or warm air inversions. Poor lapse rates at higher levels will result in storms that don't get tall enough to mature into a supercell. Either way, poor lapse rates rarely allow for tornadoes, outside of mini-supercells and QLCS situations.
 
Yes, I see that if you represent it on a graph it would appear steeper. I was thinking about it as it appears on the Skew-T. Strange because we always look at the Skew-T to visualize the environmental lapse rates. On Skew-Ts "steep" lapse rates actually appear to have a more shallow slope than below normal (6.5 C/km) lapse rates.

There's a reason such a plot is called a skew-T/log-P chart.
 
There's a reason such a plot is called a skew-T/log-P chart.
Precisely my point! The entire reason we call it a Skew-T is because the temperature line is skewed. Therefore, why refer to the temperature line as being "steep" on a line that we all know has been purposefully augmented so that high values of lapse rates appear as a shallower line? Seems ironic or at least counter-intuitive.

Sent from my SAMSUNG-SGH-I337 using Stormtrack mobile app
 
Precisely my point! The entire reason we call it a Skew-T is because the temperature line is skewed. Therefore, why refer to the temperature line as being "steep" on a line that we all know has been purposefully augmented so that high values of lapse rates appear as a shallower line? Seems ironic or at least counter-intuitive.

I think you're hung up on the idea that only a skew-T diagram can be used to assess stability.

Very unscientific explanation: lapse rates are the rate in which temperature decreases going up in height. Thus the higher values are a faster rate of decrease. So if you represented that with a graph, your line would thus have a "steeper" curve as you increased your value. Hopefully that makes some sense.

This is the best response so far in this thread. You use the phrase "steep lapse rate". Lapse rate is defined as -dT/dz, or the rate of decrease of temperature with ascent. dT/dz is a mathematical symbol in calculus representing a "derivative", which is the instantaneous rate of change of a curve along some dimension (in this case, temperature along the dimension of vertical space). dT/dz also represents a slope when a finite distance is used. So when someone computes the lapse rate between 700 mb and 500 mb (typically referred to as mid-level lapse rates), which is a finite distance btw, then the result is the slope of the line connecting the temperature at 700 mb to the temperature at 500 mb. Large slopes are typically referred to as "steep", whereas low slope values can be referred to as "shallow". Think of it like driving through the Rockies on a highway. At some points you'll be ascending or descending mountains and there will be a sign to warn you of a steep grade approaching (e.g., "6% GRADE - NEXT 2 MILES"). If you saw a sign saying "1% GRADE - NEXT 12 MILES" you probably wouldn't think of that as a very steep slope because your elevation won't be changing much with horizontal distance compared to on the 6% grade (even though, in this case, your total elevation change at the end of the grade would be the same in both cases). Lapse rate works the exact same way.
 
I think you're hung up on the idea that only a skew-T diagram can be used to assess stability.


This is the best response so far in this thread. You use the phrase "steep lapse rate". Lapse rate is defined as -dT/dz, or the rate of decrease of temperature with ascent. dT/dz is a mathematical symbol in calculus representing a "derivative", which is the instantaneous rate of change of a curve along some dimension (in this case, temperature along the dimension of vertical space). dT/dz also represents a slope when a finite distance is used. So when someone computes the lapse rate between 700 mb and 500 mb (typically referred to as mid-level lapse rates), which is a finite distance btw, then the result is the slope of the line connecting the temperature at 700 mb to the temperature at 500 mb. Large slopes are typically referred to as "steep", whereas low slope values can be referred to as "shallow". Think of it like driving through the Rockies on a highway. At some points you'll be ascending or descending mountains and there will be a sign to warn you of a steep grade approaching (e.g., "6% GRADE - NEXT 2 MILES"). If you saw a sign saying "1% GRADE - NEXT 12 MILES" you probably wouldn't think of that as a very steep slope because your elevation won't be changing much with horizontal distance compared to on the 6% grade (even though, in this case, your total elevation change at the end of the grade would be the same in both cases). Lapse rate works the exact same way.
Thank you Jeff! [emoji2]

You're right, that's exactly what I was hung up on. That's precisely why I asked that question because I was hoping to get the "complicated" technical answer you gave. I understand now. Thanks again!

Sent from my SAMSUNG-SGH-I337 using Stormtrack mobile app
 
Actually, I have never quite understood the use of the term "steep lapse rates" (in MCD discussions, etc.), and I still don't, and none of the previous replies has helped me. Let me explain. There are two (essentially) mutually exclusive lapse rates:

1) The lapse rate, with height, of the ambient temperatures. If it is 10°C at 700mb and -5°C at 500mb you have a "shallow" lapse rate. If, however, it is 10°C @ 700 and -13°C @ 500 you have a nearly dry adiabatic lapse rate that is nearly as "steep" as you can get in "normal" circumstances (not unconditional instability). Here's the rub: the steeper example as viewed on a Skew-T would lie down to the left more than the example of the shallower lapse rate. i.e., steep=shallow and shallow=steep. Here you are examining the obs trace, not the parcel trace.

2) The second lapse rate is of the implied rising parcel, and for severe weather purposes we are (basically) only interested in the saturated rising parcel trace. As the moisture increases here we see the saturated parcel trace get steeper, possibly even vertical, and so that makes perfect sense to call that steep.

What blurs the issue for me is that when the SPC talks about lapse rates... I think... they are always talking about ambient obs. So if that's true (is it???) then it makes no sense to call them steep on a day with big instability, unless it's not a reference to how it all LOOKS on a SkewT.

THAT is what I have always assumed; that it has nothing to do with Skew-T's.

Have I confused everyone sufficiently?
 
What blurs the issue for me is that when the SPC talks about lapse rates... I think... they are always talking about ambient obs. So if that's true (is it???) then it makes no sense to call them steep on a day with big instability, unless it's not a reference to how it all LOOKS on a SkewT.

When the term "lapse rate" is used in any operational sense, what's being discussed is technically referred to as "environmental lapse rate", which is the lapse rate of the actual environment. "Steep" lapse rates refer exclusively to environmental lapse rates.

Parcel lapse rates are left for the classroom or scientific papers. Besides, there are only two values of a parcel lapse rate - dry and moist adiabatic.

Thanks, Jeff. So the "steep" in "steep environmental lapse rates" must not have anything to do with Skew-T's, which is what I've long assumed. Right?
 
Back
Top