• While Stormtrack has discontinued its hosting of SpotterNetwork support on the forums, keep in mind that support for SpotterNetwork issues is available by emailing [email protected].

Was SPC actually that far off on 4/26/2016?

I didn't have an issue with the 10% hatched for the morning and noon Outlooks. However, the PDS Watch and then not updating the 2000z Outlook to reflect the Watch is what made me upset.
 
What confused me was how they had a discussion the night before as well as Q&A on Twitter the day of, where they talked about how low the sig tor risk was, with SRH being in the 10th percentile, and backing upper levels being an issue as well. They followed that up with issuing a PDS Tor watch with 80% sig tor probs. Seems like there was a miscommunication somewhere?
 
There have been far worse whiffs than 4/26 so this one in particular only stands out for the the confidence in putting out a PDS Tor watch with 90/80 probs. Other than that, I feel like the MDT was warranted given the possibility for some gargantuan hail had updraft seeding not been so prevalent with the storms that went up across SW Oklahoma up through NC Kansas. We could argue until the cows come home about the 10% hatched tornado, but even with the wind profiles being less than stellar, I think storm coverage is what precluded an appreciable tornado threat more than anything else.
 
Interesting blog post by Chuck Doswell:

http://cadiiitalk.blogspot.com/2016/04/a-busted-tornado-forecast-in-retrospect.html

Excerpt from his post below, providing some context on continuity in forecasts:

"Once a forecast is issued, subsequent forecasts tend to maintain a relatively high level, even when new information (or a new forecaster) might suggest a downgrade of the forecast. There's a reason for that: users are uncomfortable with vacillation of the threat level, and if the threat is downgraded, and then even newer information means a return to enhanced threat, the indecision can come across as incompetence. In other words, it can be unwise to back off the threat level. Moreover, there's an asymmetric penalty for missed forecasts: a false alarm for an event that never occurs can't result in human casualties and destruction, whereas an unforecasted event that kills people can be cause for investigations and possible disciplinary action. This makes overforecasting almost inevitable."

Here is a separate blog's post that you might find interesting:

https://thewxsocial.com/2016/04/28/the-hype-before-the-storms/
 
SPC did awful the day of. To go PDS Tornado Watch was a very bad idea as there were so many cautionary signs the day of and the amount of disruptions it caused as far as events being cancelled.

I know people will say I'd rather be overly cautious but the average joe is going to be nothing but ticked off and probably shrug off the next big event
 
TJ - most average Joes can't spell SPC let alone go to their website to check the outlook. Any real evidence that Joe is going to ignore the next event because of this?
 
Disclaimer: I'm no mathematician, and I sort of hastily threw this together, so if anyone sees any errors with my calculations feel free to bring it to my attention.
Everyone is bashing SPC for such a "bust" forecast yesterday, so I decided to crunch some numbers to see how far off they were.
The 10% tor risk area was 79,485 square miles. We all know that essentially means there is a 10% chance of a tornado within 25 miles of a point (any point) in the risk area.
The area of a circle with a 25 mile radius is 1,963.5 square miles. That equates to essentially just a hair over 40 circles with a 25 mile radius within the 79k sq mi area.
40 circles, with a 10% chance of seeing a tornado in each one, and there were 4 tornadoes within the area covered by those 40 circles.
That's almost precisely 10%, folks. Seems to me SPC actually nailed this portion. The sig tor (10% hatch) obviously failed to prove, but not the 10% overall tornado risk.
Again, please correct mistakes if I made any, but I think these calculations are accurate.
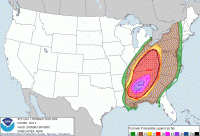
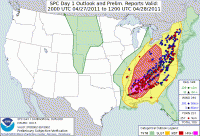
In my opinion, this methodology of verifying SPC convective outlooks makes a whole lot of sense. It is objectively based and easy to calculate and evaluate. Unfortunately, if it was used to verify many past outlooks, you'd probably find a ridiculous amount of underforecasting of probabilities for wind and hail (maybe not so much for tornadoes, though, but I have a great example coming up). Thus, this method seems rather incompatible with the context of convective outlooks as they have been issued in the past.

I think the best example of what I mean by underforecasting comes from 27 April 2011. To refresh everyone's mind, here was the tornado probability forecast at the 20Z outlook (after the event had already started, btw), and subsequent verification:
1101da3af1b75145fba8634505ea242b.gif

5d8f089ef42a61d561f0f128e9eb0fd4.gif

They weren't publishing the areas or populations enclosed in outlook categories back then, so I can't calculate the area that "should have" been impacted by a tornado within the 45% area. However, the verification plot says a lot about the appoximate areal coverage of tornadoes in northern Alabama that day, and even the size of the dots gives some indication of coverage with the 25 mile buffer around reports. Does it look like 45% of the area in that contour was near a tornado report? It sure as hell doesn't to me. In fact, it looks a lot closer to 100% (sure, you can argue me down to 90% or even maybe 80%).

Look back on a number of previous events. I'll bet you find in a lot of cases (even when accounting for overlap of buffers around reports located close to each other) that the forecast probability is underdone (assuming the area of a given probability contour isn't excessively large, in which case the area might be close, but that also means there was a significant false alarm area somewhere else).

In summary, your method might have justified a 10% tornado contour mathematically, but I'm pretty sure if you look back on other days with 10% tornado areas you'll find a lot more coverage of tornado reports within those areas. Again, you can offset the fraction of area covered by reports with buffers by just expanding the area, but that implies some sort of purposeful overforecasting of threat area, which is gaming the system, and really goes against Allan Murphy's philosophy on the goodness of forecasting.

---------------------------------------------

Gonna use this opportunity to stray off topic and get on a soapbox. I don't really agree with 1) risk areas still getting named (they're confusing and there's a 1-1 mapping between named areas and probability contours) and 2) only certain probability contours being available. I know the reason is politics/bureaucracy, but it seems antiquated and unscientific to me. It seems like such policies constrain forecasters, which would cause stress and political backfire if a certain probability threshold is or isn't included. I know this solution is already implied, but I wish SPC would make their convective outlook maps look more continuous than they do. And I think they should be allowed to insert whatever damn threshold they want (okay, I'll settle with sticking to every 5%).
 
---------------------------------------------

...Gonna use this opportunity to stray off topic and get on a soapbox. I don't really agree with 1) risk areas still getting named (they're confusing and there's a 1-1 mapping between named areas and probability contours) and 2) only certain probability contours being available. I know the reason is politics/bureaucracy, but it seems antiquated and unscientific to me. It seems like such policies constrain forecasters, which would cause stress and political backfire if a certain probability threshold is or isn't included. I know this solution is already implied, but I wish SPC would make their convective outlook maps look more continuous than they do. And I think they should be allowed to insert whatever damn threshold they want (okay, I'll settle with sticking to every 5%).

Jeff this is an interesting observation and idea. Just playing devil's advocate, but wouldn't a probability contour map paradoxically imply a greater level of specificity/predictability and create new opportunities for misinterpretation by the public? (i.e., "We don't have to worry, we're just in the 15% area, not the 30% area!")


Sent from my iPad using Tapatalk HD
 
Jeff, we are considering continuous probability fields at some point in the not-to-distant future. The problem isn't fully bureaucratic, it's also technological (i.e., we're not setup to do it easily right now).

The advantage of the "stair-step" probabilities is the ease of verification, and the ability to calibrate yourself. On the flip side, with the proper software approach, it might actually be easier to produce continuous
probabilities where the forecaster just identifies some minimum contour value and any local maxima, and the rest of the lines, etc., are handled automatically. The latter approach could certainly speed up the
outlook process, which is getting quite difficult given all of the mounting pressures for external collaboration, media interactions, and the increased difficulty of forecasting three independent elements over a large
area on "big" days.
 
Back
Top