• While Stormtrack has discontinued its hosting of SpotterNetwork support on the forums, keep in mind that support for SpotterNetwork issues is available by emailing [email protected].

Was SPC actually that far off on 4/26/2016?

Joined
Mar 15, 2015
Messages
43
Location
Wichita Kansas
Disclaimer: I'm no mathematician, and I sort of hastily threw this together, so if anyone sees any errors with my calculations feel free to bring it to my attention.
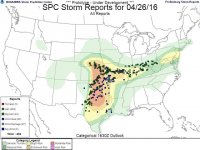
Everyone is bashing SPC for such a "bust" forecast yesterday, so I decided to crunch some numbers to see how far off they were.
The 10% tor risk area was 79,485 square miles. We all know that essentially means there is a 10% chance of a tornado within 25 miles of a point (any point) in the risk area.
The area of a circle with a 25 mile radius is 1,963.5 square miles. That equates to essentially just a hair over 40 circles with a 25 mile radius within the 79k sq mi area.
40 circles, with a 10% chance of seeing a tornado in each one, and there were 4 tornadoes within the area covered by those 40 circles.
That's almost precisely 10%, folks. Seems to me SPC actually nailed this portion. The sig tor (10% hatch) obviously failed to prove, but not the 10% overall tornado risk.
Again, please correct mistakes if I made any, but I think these calculations are accurate.

Sent from my SM-G900V using Tapatalk
 
It was a bust here in Central PA, where we had a SVR Watch and were in a slight risk, but there was only one storm that got a warning, and it didn't produce any damaging winds or hail.... And even though there were only a few "weak" tornadoes in the plains when there were supposed "violent" tornadoes, I don't think there was a bust.
 

Attachments

  • 13092169_519105061626444_6349969888166877248_n.jpg
    13092169_519105061626444_6349969888166877248_n.jpg
    79.8 KB · Views: 137
The PDS Tornado Watch clearly didn't match reality - but you also need to recognize individual forecasters and their bias... That stood out to me.
 
The only thing I thought busted was the PDS watch. You could argue their significant part for tornadoes busted as well. Other than that, they did a good job.
 
Correct me if I'm wrong, but SPC doesn't issue PDS watches in the outlooks, do they?
And my philosophy on the sig tor possibilities is such: a 10% hatched area in a 10% risk area essentially means a 1% chance of sig tor. I don't take it as a 10% overall sig tor risk. Since approximately 75% of all tornadoes are EF0/EF1, I believe this is a reasonable estimation.

Sent from my SM-G900V using Tapatalk
 
Yeah, PDS watch was a massive bust. IIRC probabilities that busted include: >95% chance of significant hail, 90% chance of 2 or more tornadoes, & 80% chance of a strong tornado.
 
Correct me if I'm wrong, but SPC doesn't issue PDS watches in the outlooks, do they?
And my philosophy on the sig tor possibilities is such: a 10% hatched area in a 10% risk area essentially means a 1% chance of sig tor. I don't take it as a 10% overall sig tor risk. Since approximately 75% of all tornadoes are EF0/EF1, I believe this is a reasonable estimation.


Jarod I don't think the 10% hatched area should be interpreted as a 1% chance (10% of 10%). The legend on the SPC tornado outlook says:

Hatched Area: 10% or greater probability of EF2 - EF5 tornadoes within 25 miles of a point.

That to me explicitly indicates a 10% risk of tornados with those ratings, as opposed to what I think you are suggesting, which is "of those tornados that form, 10% could be EF2-EF5." Remember we're not just talking EF4 and EF5 here, which are indeed very rare. Put EF2 and EF3 in the mix on the type of high-end day that gets a hatched area and the 10% probability won't seem so far-fetched to you.

Jim
 
Okay I see the confusion now. I'm referring specifically to the SPC outlook, not particular watches.
And yes James, I realize my "interpretation" of a hatched area isn't quite what they mean by it, it's just a general figure that, over the years, I've found somewhat accurate.

Sent from my SM-G900V using Tapatalk
 
Agree SPC did well. Hail verified MDT, and sig hail verified too. Hundreds of high wind reports came in. Tornado verified 10%. Tornado watches both had 2+ tornadoes. The size of the southern tornado box gave good statistical odds of verifying 2+ so the 90% was reasonable. Fortunately EF-2 was not achieved though. Perhaps the PDS box was coordinated with local offices. If they want stronger messaging for their CWA then I believe it is right to do so. I am not talking meteorology as much as local control . Anyway one could fade the PDS and go maybe 30-40% sig, while still agreeing with a 90% chance of 2+ tornadoes.
 
Agree SPC did well. Hail verified MDT, and sig hail verified too. Hundreds of high wind reports came in. Tornado verified 10%. Tornado watches both had 2+ tornadoes. The size of the southern tornado box gave good statistical odds of verifying 2+ so the 90% was reasonable. Fortunately EF-2 was not achieved though. Perhaps the PDS box was coordinated with local offices. If they want stronger messaging for their CWA then I believe it is right to do so. I am not talking meteorology as much as local control . Anyway one could fade the PDS and go maybe 30-40% sig, while still agreeing with a 90% chance of 2+ tornadoes.

Jeff, I've noticed that you have an SPC-friendly bias. No problem. I also think I have to disagree with "Tornado verified 10%". It did? That said, I don't see Tuesday as a big bust. I think the SPC did okay, not great, even on an analysis of the tornado risk only.

The 10% tornado risk area was ~650 miles N-S, and ~150 miles E-W, so that yields 650÷25 (miles between grid points)=26 grid points N-S and 150÷25=6 points E-W. 26x6=156, so if you're looking for tornadoes within 25 miles of 10% of 156 points you're looking for 16 tornadoes.

http://www.spc.noaa.gov/products/outlook/archive/2016/day1probotlk_v_20160426_1630_torn_prt.gif

Strictly within the 10% area there were only 5, but right on the periphery of the 10% area there were another 4, but only 1 of the 3 near Tulsa count because that's essentially one grid point. So let's call it 7 tornadoes the 10% area, shall we? 7 instead of 16. That is not a huge bust IMO. I started an anti-SPC thread last year on a day that I was emotional, but I do try to cut everyone some slack with the Monday-morning quarterbacking.
 
The 10% tornado risk area was ~650 miles N-S, and ~150 miles E-W, so that yields 650÷25 (miles between grid points)=26 grid points N-S and 150÷25=6 points E-W. 26x6=156, so if you're looking for tornadoes within 25 miles of 10% of 156 points you're looking for 16 tornadoes.

Differences in outlooks issued that day yield different results. You're looking at the 1655z outlook while I was looking at the 0654z. And by the 1655z the figures are 115,332 Sq mi, divided by 1,963 yields 58.7 cirlces. It appears 5 tornadoes were definitely within that area, and if Tulsa is within 25 miles of the boundary then that adds another 3 (when I made the original post only 4 reports were shown and 8 total, now 13 total) So again, 10% of 58.7= ~5.9, and 5-8 touched down so that is right on the money.
Again I'm just curious if I'm doing this figuring right because my calculations are drastically different from yours.


Sent from my SM-G900V using Tapatalk
 
After re-reading your post, I see the difference. Your calculations assume 25 miles between grid points, while technically it's 50. "Within 25 mi of a given point" creates an area (circle) with a 25 mile radius and 50 mile diameter, covering and area of 1,963 square miles.

Sent from my SM-G900V using Tapatalk
 
Back
Top