Even in an active weather situation, these grids will be made up of 0s at most grid points.
Nate, it is the extreme event I worry about the most in this discussion. The examples we get from Greg's group (see
Weatherwise article cited above) are always of an isolated supercell.
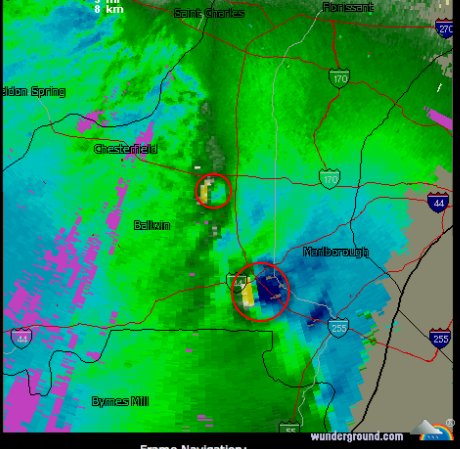
Here is a real world extreme event: KS-MO-KY derecho of May 8, 2009 which, by itself, caused more than 400 SVR reports, more than a dozen TORs, a number of deaths, multiple broadcast towers toppled, and winds at several places actually measured above 100 mph. It occurred before dawn in Kansas. As you view the photo below note that thunderstorms are firing behind the derecho along the cold front:
The meteorologist at KOAM TV (NBC) in Pittsburg, KS (who is probably there by himself/herself at that time of day) is supposed to interpret thousands of prob of TOR, SIG TOR, SVR WIND, SIG SVR WIND, HAIL, SIG SVR HAIL at half-hour intervals for Pittsburg, Joplin, Chanute, Parsons, Coffeyville, Independence, Webb City, etc., etc., etc.?
I suspect Greg will jump in and say, they can be plotted on a map. They can! But, given the fact that there are supercells (with tornadoes) ahead of the derecho, the derecho itself, and more thunderstorms firing behind the derecho, that map will just be hash.
Given that Chanute, KS (CNU) is in the path of two hook echoes and later received 80+ mph winds, isn't the smarter message,
take cover!?


