Tim Vasquez
EF5
- Joined
- Dec 4, 2003
- Messages
- 3,411
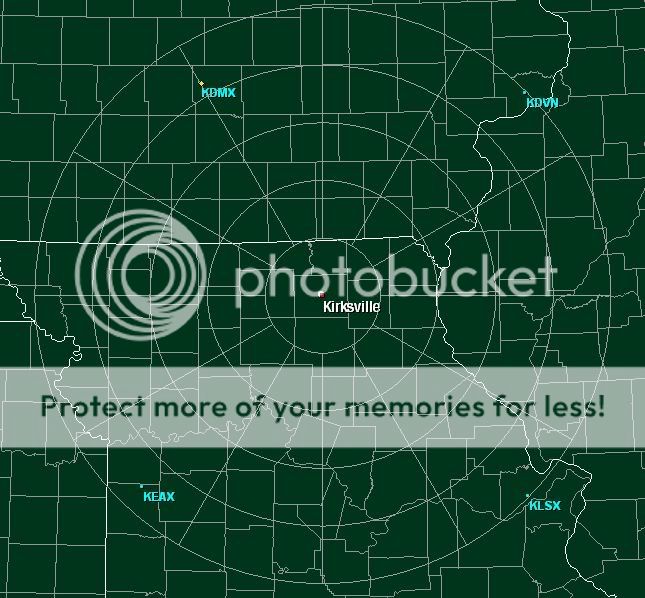
I created these graphics today to get an idea of where the "radar holes" are located and to see the basic coverage of the WSR-88D network. The green falls off at about 100 nm into reds, and the outermost blue color is at 248 nm (the limit of the base data).

Great Plains (click to enlarge)

United States (click to enlarge)
Interesting that northern Missouri (major agricultural belt) has one of the worst radar holes east of the Rockies.
Also see the following for similar maps:
http://www.cimms.ou.edu/~jzhang/radcov.html (Multi-site coverage maps, adjusted for obstructions) http://www.roc.noaa.gov/ssb/queries/siteid/search.asp (Single-site coverage maps, adjusted for obstructions)
http://www.roc.noaa.gov/maps.asp (Basic maps)
Tim

Great Plains (click to enlarge)

United States (click to enlarge)
Interesting that northern Missouri (major agricultural belt) has one of the worst radar holes east of the Rockies.
Also see the following for similar maps:
http://www.cimms.ou.edu/~jzhang/radcov.html (Multi-site coverage maps, adjusted for obstructions) http://www.roc.noaa.gov/ssb/queries/siteid/search.asp (Single-site coverage maps, adjusted for obstructions)
http://www.roc.noaa.gov/maps.asp (Basic maps)
Tim

