Lid Strength Index at CoD

Jeremy Perez

Supporter
Joined
Aug 31, 2008
Messages
342
Location
Flagstaff, Arizona, USA
If this is old news, please forgive some excitement.

I just noticed Lid Strength Index was included on College of DuPage convective products for GFS, NAM and RAP. I looked for an announcement on their site to see when it was added, but couldn’t find anything. If it’s been there for a long time, man I’m going to need a face-palm...

I made a comparison of the NAM LSI on CoD’s page to Earl Barker’s and large scale contours line up, but there are smaller scale differences. It’s probably just color mapping differences, but in some spots, it didn’t seem like either of those would account for the variations. Maybe there is some difference in how the contour vectors are calculated…I’m assuming CoD’s are finer-grained?

So, being able to view LSI for three models with easy comparison/animation to the other CoD model info makes that product much handier now. The people at CoD are awesome (and Earl Barker too for all these years)!
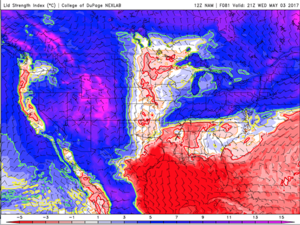
Screen Shot 2017-04-30 at 9.15.58 AM.png
 
Last edited:
I just noticed it there also and suspected it was recently added. I don't think it was available anywhere but Earl's site before so I appreciate having a second source. A number of years ago I read a comparative verification showing that LSI often performs better than CINH and LSI has been one of my favorite deep convection forecasting tools since. Before CAMs came on the scene I leaned pretty heavily on Earl's hourly RUC version of LSI and had decent success with it.
 
I'm generally not a fan of the LSI product, even if it can be shown to offer statistically better forecasts of convection initiation than CIN. Probably the biggest reason for this is the arbitrary nature of the calculation, and also the lack of specific definition. It is very difficult to find a formula for LSI anywhere, and I've seen different values used to define the mean(theta-w) term. While it has a physical basis, typical values or threshold values are difficult to interpret. For example, what significance does LSI = 0 have, if any? Also, papers discussing LSI suggest that deep convection can initiate in the presence of small positive LSI values, which kind of eliminates the utility of LSI in my opinion.

Even if LSI can be statistically abused to work better than CIN, CIN seems more physically representative and illustrative of the fundamental forces involved in initiation of deep convection. One can argue, however, that some of the same arbitrariness in the LSI formula applies to CIN when considering a mixed layer, and that is a fair argument. However, I personally understand the physical meaning of MLCIN better than I do that of LSI.

Another potentially useful product is the minimum buoyancy parameter, referred to as Bmin. It comes from Trier et al. (2014), MWR: http://journals.ametsoc.org/doi/abs/10.1175/MWR-D-13-00272.1. It is similar to the LI in that it represents a temperature difference between a lifted parcel and the environment, only here it is the minimum parcel temperature deficiency relative to the environment at any level (in other words, the temperature difference corresponding to the level in a sounding that contributes the largest CIN). Unlike CIN (but like LSI), Bmin is a continuous field, and, by definition, (is always negative and) cannot exceed 0.0. Bmin=0.0 means a lifted parcel is never colder than the environment at any level and is consistent with CIN=0. There is only one site that displays Bmin, and that is the NCAR ensemble graphics page (look for the second sub-menu under the "severe" tab). While Bmin is the same as LSI in that the vertical level at which the temperature difference is defined is allowed to vary from one point to the next, the raw calculation of Bmin is simpler than that of LSI.
 
Last edited:
Glad to see some are enjoying the addition of LSI. I threw it up there a couple weeks ago.

I'm calculating it similar to Graziano and Carlson (1987). Basically, I loop through all vertical levels and determine the highest *saturated* wet-bulb potential temperature (i.e., nose of the cap). Then I subtract wet-bulb potential temperature for a 100-mb mixed layer parcel. This is very similar to the Equation 1 term A that they show in their paper. I'll be evaluating it this year to see which parcel choice works best.

I personally believe LSI combined with 700mb UVV is great combination for determining cap breach and ascent forcing to the potential LFC.
 
Back
Top