• While Stormtrack has discontinued its hosting of SpotterNetwork support on the forums, keep in mind that support for SpotterNetwork issues is available by emailing [email protected].

2025: Year Without a Winter in the Western US

Harlan U

EF0
Joined
Feb 13, 2024
Messages
14
Location
Denver
It seems most of the members of Stormtrack are based in the eastern half of the US, so I thought I would post an update on how we've been faring out west this winter...

The La Nina pattern this year has been coupled with unusually persistent ridging over the West Coast with only minor exceptions, and it's taken a major toll on snowpack in the Southern Rockies. The cold air outbreaks that have been buffeting the eastern half of the country have also largely missed us here with the exception of the one going on right now.

I'll be mainly examining the period from October to January, as September was reasonably normal here (in the Southern Rockies at least). September 2025 was Denver's first below-average September in 14 years (0.1 degrees below normal-link).

From October to December, persistent ridging over the west produced record warmth for almost every western state. Denver, and many other places, saw the warmest Christmas Day on record. Denver's high on Christmas Day hit 71 degrees, with the previous record being 69 degrees, set in 2005 (link). Mountain towns in Colorado like Vail, Aspen, Steamboat Springs, and many others saw rain on Christmas Day, along with temperatures in the 50s (news article) (data link).

When looking at statewide average temperature from October to December, the stats speak for themselves:
(State temperature/precipitation maps from U.S. Maps | National Centers for Environmental Information (NCEI))
1769136283373.png

Meanwhile, thanks to a series of robust atmospheric rivers, statewide precipitation across the West was actually at above-normal levels.
1769136467032.png

But yet, despite ample precipitation, snowpack across the West is still much below normal. I'm using the latest data from today, January 22nd, for the following snowpack images. All of the following images were generated using the NWCC iMap, which is a fantastic tool for monitoring snowpack across the West.

Note: Snow Water Equivalent (SWE) will be the metric used in most of these images unless otherwise mentioned, which for the uninitiated is a measure of how many inches of water would be produced if the snow was melted. This metric is used instead of snow depth because snow density heavily influences how much water content is in the snowpack, and water managers are more concerned about the water than the snow depth. Skiiers would be more concerned about snow depth, and I'll discuss that later.

At the moment, SWE is generally much below the 1991-2020 median across the West's river basins, with the exception of a few basins in Montana, Wyoming, and California.
Snow_Water_Equivalent_Percent_NRCS_1991-2020_Median_January_21_2026.jpeg

And yet, at the same time, most of the same river basins have seen normal or above-normal amounts of precipitation.
Water_Year_to_Date_Precipitation_Percent_NRCS_1991-2020_Median_October_1_2025_-_January_21_2026.jpeg

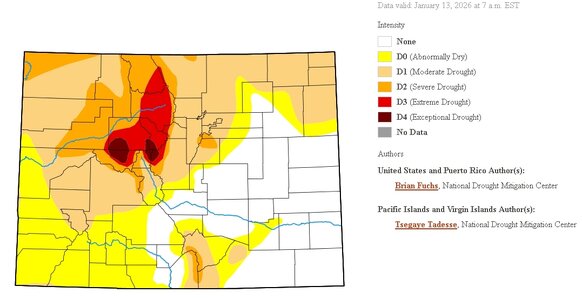
The natural conclusion from these stats is that the precipitation has been falling as expected, but that temperatures have been too warm for it all to fall as snow. This has potentially drastic implications for the upcoming summer's river levels, especially in the Colorado, Platte, Arkansas, and Rio Grande river basins. Snowpack also has an impact on the summer fire season, and a poor snowpack combined with a warm summer can increase the likelihood of fires. A discussion of the importance of snowpack as opposed to rain can be found at the following links:
A Warmer Spring: How a Changing Snowpack is Altering Colorado’s Environment | Sustainability | Colorado State University
Understanding Snow - Water Education Colorado
SnowTrax - Home

Speaking of the Colorado River, Snow Water Equivalent in the Upper Colorado Basin is currently at its lowest level for January 22nd since records began in 1986.
For the following two maps, the upper dark blue line is a composite of the highest SWEs for each day of the winter over the years, and the lower red line is a composite of the lowest SWEs for each day of the winter. The shading corresponds to the percentile categories. Percentile categories range from: minimum to 10th percentile , 10th - 30th , 30th - 70th , 70th - 90th , and 90th - maximum. The green line is the median (1991-2020).
14_upper_colorado_region-2-wteq-por (1).png

Things are similar in the State of Colorado, with current statewide Snow Water Equivalent conditions being the lowest on record for this date. Records stretch back to 1987.
state_of_colorado-co3-wteq-por.png

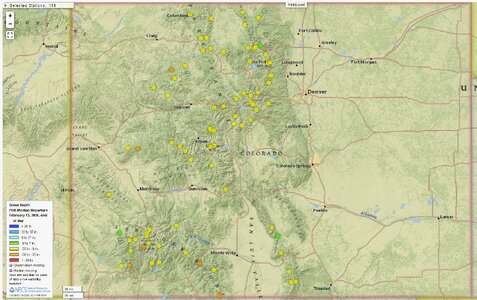
When looking at individual snow monitoring stations, the picture is also very grim, and reveals an interesting pattern between snowpack and elevation. The following map for the Southern Rockies shows stations experiencing their lowest ever SWE in red, and stations experiencing their second lowest SWE in orange. The period of record (POR) stretches back ~45 years at most locations. Many of the locations shown as transparent circles don't have a sufficient body of data to display records, but it's worth noting that many of these newer stations are still experiencing their worst or second worst SWE on record.
Snow_Water_Equivalent_Records_(POR)_January_21_2026.jpeg

West-wide, many stations are currently experiencing their lowest SWE on record, even in the river basins that have near-normal SWE overall! Many of the stations at lower elevation in Wyoming and Montana have much below normal SWE even though the neighboring higher stations have a normal or above-normal SWE. This seems to be due to temperature, as the lower elevation stations have seen temperatures too warm for snow even though ample precipitation has been falling.
Snow_Water_Equivalent_Records_(POR)_January_21_2026 (1).jpeg

What about snow depth? This is something a skiier would care about much more than SWE. Well, across the Southern Rockies, snow depth conditions are actually WORSE than SWE conditions! It's worth noting that most snow depth observations only have a 25-year history, so years before 2000 generally aren't factored into the following maps.
Snow_Depth_Records_(POR)_January_21_2026 (2).jpeg

Looking at the West as a whole, snow depth is still generally near its lowest level in the last 25 years across the lower elevations. Snow_Depth_Records_(POR)_January_21_2026 (3).jpeg

Of course, there's still plenty of time left in the winter, and the West's mountains typically see their greatest snow accumulations in February, March, and April. So theoretically we could see a few huge storms, and the snowpack would return to near-normal levels. However, long-term forecasts aren't looking overly optimistic. If the current trends continue on, we could see serious drought develop this summer across the Southern Rockies, and we could see the potential for a very destructive fire season.
 
I'll have to check out(and save) those links you included in your post...was looking for stuff like that a couple weeks ago when I was putting together something related to the drought here (that got posted elsewhere)
I'd planned to post something here on ST as well, but never got around to it, so will just add to your thread

-----------------------
Yeah things have been bone dry here where I am(east side of the mountains, and not far from them), we had only one meaningful snow (7" on Dec 3) before the end of the year.
It was so dry during Oct/Nov/the latter part of Dec, that I had to go water the (dormant) lawn a few times. Even got to the point where the dirt was getting dry/crumbly & coulda been blown around by the wind.
Overall start of this season to some degree reminded me of a few years back when the Marshall fire happened. (thankfully nothing like that happened this time).

But anyway me & a family member made a daytrip into the mountains in early January, it was pretty shocking (and kinda sad) seeing just dry things were & the lack of snow up there.
I (just being me) took the camera & got photos along the way (This is done along Highway 285). Gonna attach some below along with a couple other things.
I put numbers in the top left corners of each to match up with this list:
#1 Taken somewhere between Baily & Kenosha pass, note the total lack of snow.
#2 Top of Kenosha pass (10k feet elevation), note how little snow is on the ground up here
#3 South of Kenosha pass, looking up into the high mountains (you can see where timberline is), again even way up there look at how little snow there is.
#4 Don't remember location forsure, but I believe this was taken near the town of Buena Vista.
#5 A couple miles off the highway from Trout Creek pass(elevation over 9k feet), again note the lack of snowcover
Map showing highway along where photos were taken
CO drought map as of Jan 13
 

Attachments

  • 1-3a_S8730007.jpg
    1-3a_S8730007.jpg
    324.3 KB · Views: 2
  • 1-3b_25a.jpg
    1-3b_25a.jpg
    345.4 KB · Views: 2
  • 1-3c_S8730031.jpg
    1-3c_S8730031.jpg
    298.6 KB · Views: 3
  • 1-3d_S8730041.jpg
    1-3d_S8730041.jpg
    270 KB · Views: 3
  • 1-3e_S8730053.jpg
    1-3e_S8730053.jpg
    373.3 KB · Views: 3
  • 1-3_map.jpg
    1-3_map.jpg
    106.7 KB · Views: 4
  • 1-3_drought_1-13_co.jpg
    1-3_drought_1-13_co.jpg
    201.7 KB · Views: 4
Yeah things have been bone dry here where I am(east side of the mountains, and not far from them), we had only one meaningful snow (7" on Dec 3) before the end of the year.
I've made a few trips to the mountains recently and was quite shocked at the lack of snow cover. I camped at Brainard Lake (10,300') from December 22-23, and it didn't dip below freezing the entire time, not even overnight.

BrainardCirqueResized.JPG
Navajo (13,409'), Apache (13,441), and Shoshoni (12,967') peaks (left to right) on December 23, 2025. Quite dry for this time of the year. Navajo Glacier (left) and Isabelle Glacier (right) are the only two areas of deep snow cover.


DryAudubonResized.JPG
Mt. Audubon (13,229') generally free of snow on December 23, 2025.

I also climbed Humboldt Peak (14,067') on December 30 and I was utterly shocked by how warm and dry it was. Below treeline there was snow but the air temp was in the 50s and it felt unbelievably hot with the southern sun beating down. I only needed to put on my sweater at 13,000 feet.

HumboldtSlopesResized.JPG
Eastern Slopes of Mt. Humboldt seen from 13,500' on December 30, 2025. View of the Wet Mountain Valley below and the Wet Mountains in the distance.

HumboldtSummitResized.jpg
Generally snow-free summit of Humboldt Peak (14,067') on December 30, 2025.

SangresNorthResized.JPG
View of the Sangre De Cristo Range to the north of Humboldt Peak, taken from the summit of Humboldt on December 30, 2025. Most of the peaks seen here are above 13,000'. Mts Shavano, Antero, Princeton, and Harvard can be seen in the background of the image. Mt Princeton (14,200'), just left of the center of the image, is the mountain in your 4th photo.
#4 Don't remember location forsure, but I believe this was taken near the town of Buena Vista.
 
@Harlan U:
Your photos - especially those taken from the summit of Humboldt, really show things well.

Me & my brother joked about it being almost campable up there in the week before Christmas (at location where my #5 was taken)

And thanks... I was thinking #4 was the one I took just before we turned off 285 to head into Buena Vista, you verified that!
my brother & a couple of his friends climbed Mt Princeton & I believe Antero, & Harvard too at various times a few years ago

I know there's been some snows in the mountains more recently, still below normal up there, but I can say one thing.. Atleast I can see white up on the higher peaks when looking from home now.
 
Seeing the mountains from the Denver metro, which would normally be completely coated in snow this time of year. There is basically nothing. Only some of our tallest peaks have any pack, and even then it's very thin and patchy. Keep in mind too that we got several inches of snow just a few days ago. Everything has already melted, and all future GFS runs for now are showing basically the entire Rocky Mountain region under either a ridge or the NVA side of any future weather systems. Its very concerning, and not only could our fire season be significant if things don't change, but our storm season here could be below average too considering how our ground moisture does much of the heavy lifting when there's no Gulf air advection here.
It's all the more apparent when looking at satellite. Snow pack is seen as the cyan shades, and throughout the entire Rocky Mountain west, everything is clear with the exception of some of the higher elevations and mountains.
Untitled.jpg
 
With the persistent cold and finally a return to a decent snowfall in the East after several winters, the mild wx and lack of snow in the West is not too surprising. Cold in the E, mild in the W, as the trope goes!

* BOS recently had 23.6" of snow for its 8th largest snowstorm in record. Up to 27" in MA and it was southern New England's biggest
snowstorm 4 years.

* NC outside the mountains just had its largest snowstorm in 36 years w/ up to 19.5" along the coast.

* Toronto (CYYZ) set a new record for snow depth on 1/24 w/ 41 cm (16").

* Second winter in a row accumulating snow in FL and record cold into the deep tropics w/ Cuba recording its first 32 F reading on record.
Belize recently its lowest temp recorded (42 F) since 1968.

* On 2/3, the cold front associated w/ the FL/Cuba record cold apparently got close to the northern South American coast!


On the subject of BOS snowstorms, 7 of its 10 biggest snowstorms all have occurred since 1997, and the 30-yr normal period 1991-2020 was the city's snowiest 30-yr period on record. The avg season snowfall went up 7" from 42 to 49" compared to 1981-2010 normal period, which is remarkable given the the airport climate location is surrounded by ocean on three sides and a gradually warming ocean avg temp over time.
 
Last edited:
Western Snow Update:
Colorado and Utah are both currently experiencing their lowest SWE on record for this time of year.
state_of_colorado-co3-wteq-por (2).png
state_of_utah-ut3-wteq-por.png


Additionally, the Upper Colorado River Basin is at its lowest SWE on record, with potentially huge implications for the Colorado River if things don't change.
14_upper_colorado_region-2-wteq-por (1).png

Reservoir levels in the Colorado river basin are not great either. Both Lake Powell and Lake Mead are much below their normal levels. An older news article from early January describes the situation at Lake Mead:
https://www.sfgate.com/national-par...rains-largest-reservoir-in-peril-21273482.php

Reservoir level data can be found at the following links:
Lake Mead Water Level
https://lakepowell.water-data.com/

Currently, no single basin across the entire west is above median SWE for this time of year.
Snow_Water_Equivalent_Percent_NRCS_1991-2020_Median_February_4_2026.jpeg

In many locations, no snow has fallen since early January. As an example, I'm choosing to examine the Middle Snake-Boise river basin in southwestern Idaho. Note the plateau in snow accumulation after early January. It's unusual to see such long periods without any snow accumulation in the West.
170501_middle_snake-boise-6-wteq-por.png

Pattern change expected:
Feb 12-15th shows promise of a pattern change which could bring some much needed moisture to the west.

And there's signs La Niña is breaking down and weakening which should allow for some continuous storms to get rolling.
Starting next week, the persistent ridging over the west coast is expected to finally weaken as a combination of factors (weakening La Nina, MJO progression) erode the ridge. This should open the West to pacific storms going forward into late February and March, and many long-range models have positive precip anomalies for this time frame. I'm going to avoid posting forecast images because long range climate models are very unreliable, but the general trends are towards more precip and below normal 500mb heights for late February and March.

There is possibly hope for recovery in the snowpack over the next couple of months. In the past, we have occasionally seen "Hail Mary" type storms in the spring season which can dramatically improve snowpack. In Colorado, the winters of 1989-1990, 1999-2000, and 2012-2013 all saw a very dry start to the winter, with a recovery to near or below-normal levels occurring right around now. One can hope that something similar will happen this year.
state_of_colorado-co3-wteq-por (5).png


Overall, much cause for concern across the West, but the season isn't over yet, and we could still see snowpack recover to acceptable levels if we get a wet enough spring. Time will tell.


Eastern US:
* BOS recently had 23.6" of snow for its 8th largest snowstorm in record. Up to 27" in MA and it was southern New England biggest
snowstorm 4 years.

* NC outside the mountains just had its largest snowstorm in 36 years w/ up to 19.5" along the coast.

* Toronto (CYYZ) set a new record for snow depth on 1/24 w/ 41 cm (16").

* Second winter in a row accumulating snow in FL and record cold into the deep tropics w/ Cuba recording its first 32 F reading on record.
Belize recently its lowest temp recorded (42 F) since 1968.

On the subject of BOS snowstorms, 7 of its 10 biggest snowstorms all have occurred since 1997, and the 30-yr normal period 1991-2020 was the city's snowiest 30-yr period on record. The avg season snowfall went up 7" from 42 to 49" compared to 1981-2010 normal period, which is remarkable given the the airport climate location is surrounded by ocean on three sides and a gradually warming ocean avg temp over time.
You're making me jealous! It seems like things have been the exact opposite out West, with a string of hot and dry years one after another, broken by the occasional wet year (2023) or arctic air outbreak (2022). It seems that for every cold/snow record in the East we set a new heat/drought record.

I've seen across various sources that there has been an overall trend of cooling in the Southeastern US over the past 100 years or so, generally referred to as the "Southeast Warming Hole". I can't speak to the causes of the phenomenon, but the evidence seems to be there. An interesting NOAA article describes some of the observed cooling:
Mapping U.S. climate trends

I found a few scientific articles that discuss the phenomenon, although they largely draw no conclusions as to the cause of the observed cooling.
https://agupubs.onlinelibrary.wiley.com/doi/full/10.1002/2017GL076463
https://agupubs.onlinelibrary.wiley.com/doi/pdf/10.1029/2024GL109099

One hypothesis is that a weakened and more wavy polar jet stream is allowing more arctic air to infiltrate the region. An article by Dartmouth University discusses this in more detail: https://geography.dartmouth.edu/news/2018/02/polar-vortex-defies-climate-change-southeast
 
The "snow drought" in the Mid-Atlantic and Northeast has been very apparent in recent years. After a very snowy period 1992-93 to 2015-2016, it has gone down markedly since. Now, this winter has been much better, but even in "dud" periods, there are "good" snow seasons. This same area experienced a "snow drought" overall 1978-79 to 1991-92, but there were several big snowstorms during the period, but much less compared to the 1950s to late 1970s and 1992-93 to 2015-16. It comes in cycles. I think due to human recency bias, our perception is skewed a lot to the "here and now" when we should really think more abstract and long-term.

I do like what Hannah said in a previous post it is the least snowpack in the Intermountain West on record, and the important context detail was mentioned "since the late 80s." This is paramount when talking about *any* extremes, period of record (POR)! All too often that is left out of the mainstream narrative b/c it would otherwise deflate the drama and hype of the story. You can't take relatively short wx/climate periods and c;laim this is actual real trend overall in any direction.

There is value in looking at short-term trends in any region, as you said nicely above, since it helps us understand wx/climate variance better and thus *forecast* it better. However...

I'm not to keen on the wavy jet stream hypothesis due to warming, at least as to something being "wrong" w/ wx/climate. The jet stream can get equally or more wavy in a cooler climate b/c the polar regions cooling more than the tropics, hence a greater thermal contrast from the polar to tropical regions. This results in great baroclinicity, which in turn drives more intense cyclogenesis, which amplifies (wavy) the jet stream, driving cold air farther S, and at the same time, warm air farther N.

The point is that whether warmer or colder for global temps and trends, the same sensible wx occurs net-net. Is it exactly 1-1? Of course not, but that's more noise that anything b/c normal climatic variation embedded within long-term global temp change dictate most of the variance we see short-term (i.e. year-to-year to decades). There are no less than 15 global oscillations (ENSO, PDO, AMO, IOD, etc.) going on at any one time, all in different states and interacting w/ one another. That is what results in what we see for sensible wx and trends over the short-term.

When the basically the same sensible wx occurs in different global states (avg temp or otherwise), I ask, "how is that a 'problem' per se?"
 
When looking at the forecasts last week, it was looking promising that we might get some snow this week (was chances basically every day both down where I am & in the mountains (never anything high, but atleast chances)), that has gotten progressively worse as the days went along ... now they're talking chances of rain down here. (yes any precip is good & I'll gladly take it, but rain in february? that aint 'normal'), plus if it does rain & then that stuff then freezes on the ground overnight there might be some pretty slick spots).
What snow we do get in the mountain location I look at looks to be pretty minimal. (see last 2 images for forecasts.. local to me, & mountains)

We got ~1.5" of snow where I am a Sunday couple weeks ago, plus .5" each that Fri & Sat (long gone now), plus some bitter cold .
Then it was back to dryness.

Also uploading a few photos:
First 2:
From a local place (Chatfield state park) on Jan 31. In a normal year, this time of year, that lake would be solidly frozen over with a layer of snow ontop. This year...would you walk out on that ice? I certainly wouldn't!

3rd:
Taken from home, Feb 6. Just looking up towards the mountains, this spot where I can see farther back/up.. the snow looked kinda blotchy. Zooming in & taking a photo showed just why it looked kinda blotchy to the naked eye. Those mountains should be covered with a thick blanket of white.
(the foothills in the foreground, its normal for most of the snow to melt between storms, save for the north-facing slopes, but what you see there is far drier than normal)
No image, but even at home all I have to do is look out the backyard, dead & barren, which in a "normal" year would have 3-6" of snow at this point (snow that'd be there til atleast early spring!)
 

Attachments

  • cl_0148.jpg
    cl_0148.jpg
    321.4 KB · Views: 1
  • cl_s576.jpg
    cl_s576.jpg
    206.6 KB · Views: 1
  • m_8880001.jpg
    m_8880001.jpg
    307 KB · Views: 1
  • 2-9_local.jpg
    2-9_local.jpg
    226 KB · Views: 1
  • 2-9_mountain.jpg
    2-9_mountain.jpg
    240.3 KB · Views: 0
For a great overview of current drought conditions, including some crazy stats (95% of stations in Colorado are in snow drought), see a recent Drought.gov article posted on February 5th:
https://www.drought.gov/drought-status-updates/snow-drought-current-conditions-and-impacts-west-2026-02-05

For a TLDR of everything I'm about to say, please see this excellent post by the Colorado Climate Center: How does this year compare to the snow droughts of the past? - Colorado Climate Blog

2025-2026 Winter Comparison With History
I mentioned in my first post on this thread that the period of record used to generate most of the scary graphs above only stretches back to 1987. When talking about climatology, this isn't a very long period of record, and also has the affect of possibly making this year look worse than it actually is. I've mentioned that we're experiencing "record" low snowpack, but of course the period of record (POR) for SNOTEL automated snow observations is only 39 years long.

I've seen a number of comparisons recently between this winter and the huge, historically significant winter droughts of 1976-1977 and 1980-1981. Those years fall just outside of the POR for most SNOTEL stations, and so they don't show up on the statewide SNOTEL graphs seen above. So, I'd like to examine how comparable our current winter is to those dry winters of old.

There weren't any SNOTEL stations in Colorado for the winter of 76-77, but a few locations had them for the winter of 80-81. Using data from these individual stations, we can see that at most stations the current snowpack is actually a lot better than in 1980-1981, which was probably the worst snow year in modern history. Vail Mountain is an exception, and at that location this winter is currently worse than 1980-1981.
university_camp-co-wteq-por.png


vail_mountain-co-wteq-por.png


I guess this is good news in that the current conditions aren't really unprecedented, and that similar scenarios have played out in the past. However, I think it's noteworthy that Lake Mead and Powell weren't completely drained before the winters of 76-77 and 80-81, so they were able to absorb the hit from low runoff. We're not in a similar position today, and the reservoirs are both already near the level at which power generation becomes much less efficient or stops entirely, and inputs from snowmelt aren't expected to be particularly large this summer.

The Colorado Basin River Forecast Center puts out monthly presentations examining the snowpack situation and predicting runoff. Their most recent presentation, from February, can be found at the following link: https://www.cbrfc.noaa.gov/present/2026/cbrfcwsupfeb2026.pdf
It's pretty grim, and we might be in serious trouble this summer if things don't change.


Snow Course Markers
I recently discovered (through the Colorado Climate Center) that there's a network of manual snow observation sites across the Rockies that has been operational since the 1930s. Observations of snow water equivalent and snow depth are taken once monthly in February, March, April, and May. In select locations this network has a 90+ year record of mountain snowpack, and more broadly it spans 50-80 years, giving us a much more complete picture of historical snowpack than the recently introduced SNOTEL stations.

So, how does this winter stack up to other dry winters over the past 90 years? At almost all snow course stations in Colorado, the lowest SWE values in a 50-90 year history were recorded during the winter of 1980-1981, followed closely by the winter of 1976-1977. A few locations across southern CO have all-time low records during 2000 or 2017. Only a few stations have recorded their lowest SWE for February in 2026.
Snow_Water_Equivalent_Year_of_Minimum_(POR)_February_1.jpeg


The picture is a little different in other areas. In New Mexico and Arizona, there are a number of "worst years" at each site, probably because values of 0 were recorded multiple times.
Snow_Water_Equivalent_Year_of_Minimum_(POR)_February_1 (1).jpeg


To the north, it appears that 1976-1977 was particularly bad, followed by 2023-2024 in some areas.
Snow_Water_Equivalent_Year_of_Minimum_(POR)_February_1 (2).jpeg

You can check out this data for yourself at the following link: NWCC iMap


The takeaway from all of this?
This year is definitely bad, but similar snow droughts have occurred in the past. However, the dry winters of 1976-1977 and 1980-1981 were sandwiched between a number of wet years. Reservoir storage was at acceptable levels before these dry winters happened, allowing their negative effects to be mitigated. We don't have that luxury this year, as reservoirs west-wide are already nearing record low conditions.

In the following graph, note the greatly reduced frequency of wet periods after 2000, and the increasing consistency of droughts. (Graph from NCEI's Climate at a Glance Climate at a Glance | National Centers for Environmental Information (NCEI))
HistoricalPalmerWest.png
In comparison to 1977 and 1981, I believe that this winter's snow drought impacts will be made much worse by the fact that the west is already experiencing drought conditions, and essentially has been for 25 years.

Additionally, it's very interesting to note that all of this is not a consequence of low precipitation. This winter has been marked by above-normal precipitation mostly everywhere (see my first post on this thread) but incredibly warm temperatures. Some may argue that this is the mark of climate change. The snow drought this year has been caused by anomalous ridging (weather) and not necessarily climate, but you really can't help but think that global warming has at least tacked a few degrees onto the existing highs. Going forward, it seems that years like this may become more of the norm...
 
Back
Top