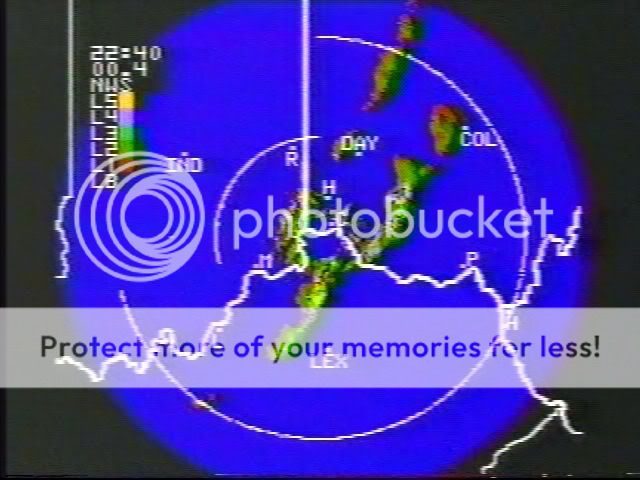
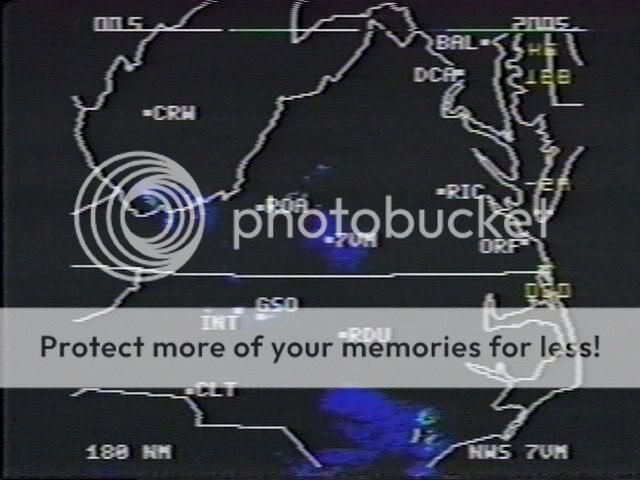
I'm not sure what company manufactured the equipment that produced the video display in question. All the Cincinnati TV stations had one of these and customized their displays (color palettes, cities and so on). It commonly used the 50 and 100 n-mi range rings (for the 125 mile range) to indicate the antenna location, although I did see one use a traditional sweep line. The color table always runs from VIP 1 to 5, with level 6 being the same as the scope color.
Since we're on the subject, I thought I'd post a few of my images. These are from the CVG radar (Covington, KY). This site was commissioned in 1960 and decommissioned in 1995. The local NOAA weather radio broadcast played as the audio for this channel.
This first image is from 4/3/88.
From the 6/2/90 tornado outbreak. They changed the background to a darker blue and made some minor adjustments to the color palette by this time (and yeah, that's lottery numbers at the bottom). Level 6 can be seen as the dark colored core of the storm west of Cincinnati.
A similar display at WKRC-TV on 6/2/90
This type of image was commonly used by TV stations and TWC (in the 80s). I belive the provider was Kavouras, although the file name says WSI. A fake sweep line can also be seen.
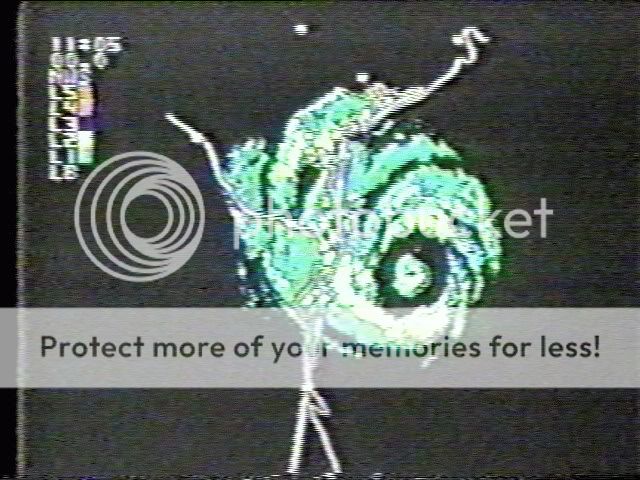
From the Brownsville, TX site. I'm not sure which hurricane is pictured, but it would of been before 1987.
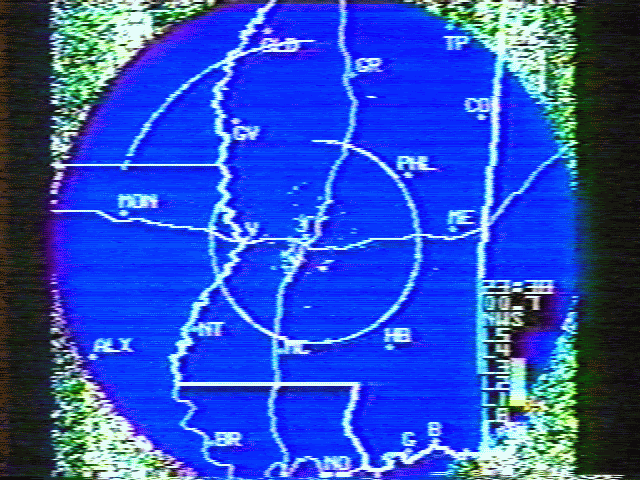
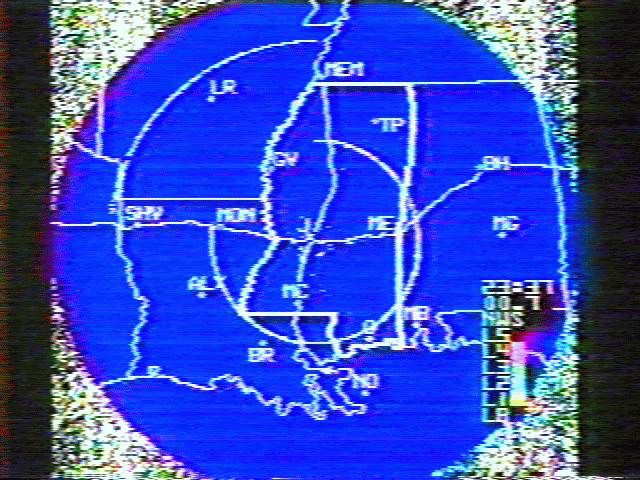
This radar image actually appeared as part of the local forecast on TWC in the 89-91 time frame in Jackson, MS. The range changes from 60x60 n-mi, to 125, then to 300
I do have some older video of radarscopes from the 60s and 70s. I'll see about posting it later. The only ones that come to mind are from the 74 outbreak (WHIO-TV) and there's one on one of the Tornado Video Classics videos (4/3/64, Wichita Falls).


