• While Stormtrack has discontinued its hosting of SpotterNetwork support on the forums, keep in mind that support for SpotterNetwork issues is available by emailing [email protected].

Tornadoes shifting east in the U.S., study finds, putting more people at risk

Thanks, Mike.

I don't think the above is the paper I was referring to. I clearly remember that paper containing a figure showing a circular area centered over NE AR, maybe a few hundred miles in diameter, with a radial axis (I think it was oriented NE or SE?, or at any rate, away from OK), hence my jocular reference. According to this hypothesis, whichever "direction" the radius was oriented was where tornadoes were "expected" to be concentrated for some period of time (which I do not recall). Also, over time, this radius would change direction based upon "current" data. In addition, I recall that Dr. Fujita was the sole author, or at least lead author along with one or more of his grad students (e.g., Forbes, Umenhoffer, Pearl, etc.)...so it was an in-house U of Chicago publication, if memory serves. I'd love to find and read a full copy of this paper again, for old-times sake.

BTW, I did an aerial damage survey of the Ash Valley (Great bend), KS, tornado in August, 1974, with Umenhoffer and I worked with Ed Pearl in Beltsville, MD, under Col. Robert C. Miller, USAF-Ret., as a severe-storm researcher in 1976. I also recall Dr. Joe Golden, Dan Purcell, and I doing an aerial damage survey with Dr. Fujita, but don't recall whether it was Ash Valley. Dr. Fujita and his students were very active during that period, and cranked out numerous papers (BAMS, JAS, JAM, MWR, Weatherwise, AMS Conference preprints, etc.).
 
I clearly remember that paper containing a figure showing a circular area centered over NE AR, maybe a few hundred miles in diameter, with a radial axis (I think it was oriented NE or SE?, or at any rate, away from OK), hence my jocular reference. According to this hypothesis, whichever "direction" the radius was oriented was where tornadoes were "expected" to be concentrated for some period of time (which I do not recall). Also, over time, this radius would change direction based upon "current" data

Randy,

That is the paper. Fujita came out with a simplified version that talked about a 44 year cycle centered over Piggott, Arkansas.
 
Randy,

That is the paper. Fujita came out with a simplified version that talked about a 44 year cycle centered over Piggott, Arkansas.
O.K., thanks for your help, Mike!! That sounds about right--Piggott is about as far NE as you can get and still be in AR! I probably am referring to the simplified version. I'll look it up online and print out the full paper. Thanks again! RZ
 
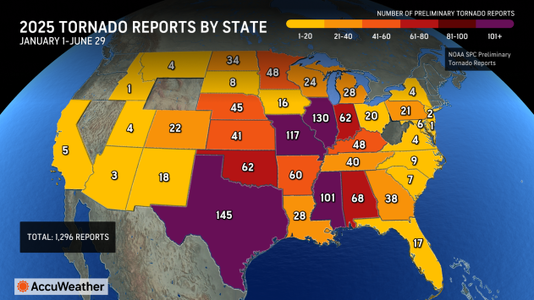
Seems 2025 was another year of more activity west of Lubbock, notwithstanding the above map posted by @William Monfredo , which of course covers a longer period.
I am not sure. TWC when I was watching I think this morning had a map like the one below from AccuWeather except that the TWC map had these same numbers color-coded relative to the average rather than by the number. Unfortunately like many things I see on their TV broadcasts, I could not find the TWC map online, so am sharing the AccuWeather one.

2025tornadoes.webp
Texas has the most total, although not relative to land area. All the states that are purple on this map are above their historical averages for this point in the season, but the two MOST above average are MO and IL. As to west of Lubbock or not, TX has a lot but I am guessing the large majority are south or SE of Lubbock. NM is above average, and AZ probably, too, so there are places west of Lubbock above average. But the most above-average areas are not west of there, June 5 notwithstanding.
 
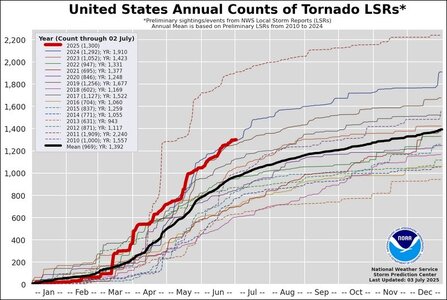
Speaking of putting more people at risk, here is a comparison of annual tornado occurrences in the U.S. for two different historical periods: the 70-year period from 1915-1985 [source: U.S. Tornadoes, Part 1, 70-Year Statistics, T. Fujita, 1987] and the WCM Statistical Data pages on the Storm Prediction Center website for the 14-full-year-period from 2010-2024. Call it "global warming" or "climate change" or whatever, but the results are pretty startling:

(1) Comparing the two top years from each dataset: 1,110 tornadoes in 1973 versus 2,240 tornadoes in 2011, more than doubling.
(2) Comparing the 14-full-year mean (2010-2024) of 1,392 tornadoes with the highest tornado total of 1,110 (1973), a 25% increase.
(3) Thus far in 2025 (through 07-02-2025), the 1,300 total recorded tornadoes versus 1,110 tornadoes (1973), 17% higher.
 

Attachments

  • Tornado Annual Occurrences 1915-1985 [T. Fujita, 1987].jpg
    Tornado Annual Occurrences 1915-1985 [T. Fujita, 1987].jpg
    114.6 KB · Views: 3
  • Screenshot 2025-07-04 at 06-24-09 Storm Prediction Center Maps Graphics and Data Page.jpg
    Screenshot 2025-07-04 at 06-24-09 Storm Prediction Center Maps Graphics and Data Page.jpg
    102.8 KB · Views: 3
Last edited:
More chasers are now chasing in the once avoided eastern areas. This includes regions of poor radar coverage or complete holes. In addition, better communications (e.g., Starlink) and the advent of drones are allowing for more severe weather reports. I'm assuming there will be maps showing an increasing number of tornadoes in the northern states, given the number of chasers in those regions. Data before 2010 and
earlier is flawed by the same reasoning, as chasers were only congregating in the classic regions. Having said this, there is an obvious relationship between drought conditions out west and storm development to the east.
 
Back
Top