Carl Jones

Enthusiast
Joined
Jun 15, 2014
Messages
8
Location
Grand Forks
So I was searching for highest observed CAPE values via rawinsondes. To my surprise, it has been rather difficult finding resources with this information. So I decided to make a list of the top 10 SB/ML CAPE values using SPC's sounding climatology page: http://www.spc.noaa.gov/exper/soundingclimo/. This was done subjectively recording value, location, and date* associated with the highest bar.

*SPC does not provide years of values, only the day, month and either 00/12 UTC time. This also means special soundings (18Z, 21Z, etc..) are not included.

I hope this forum post will serve as a resource providing top observed SB/ML CAPE values. The list provided only includes values from NWS offices currently active within the Upper-air Observations Program. Therefore, private, international, and deactivated office soundings are not included. So if anyone has values that may rank within the list, please share with a link/picture of the sounding for quality control. I hope this to be a good starting point, and I encourage other members to add, omit, suggest and quality control CAPE values within the list/post.
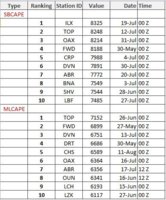
20160715_HighestCAPE.JPG
 

Attachments

  • 20160715_HighestCAPE.pdf
    202.6 KB · Views: 119
I made sure to grab this one from last year. July 13th, 2015. With a value of 8383 j/kg this is the highest officially measured SBCAPE I am aware of. Many of the model forecasts were for 9000+ and even 10000+ j/kg in this area the day before.

ec945b51fffed3629771e1c8bd5ba5c2.gif
 
I would try to stick to MLCAPE to get a better representation of true large scale instability. In both of the soundings posted above, there is a significant moisture drop off immediately above the surface, and since the surface-based parcel only takes into account the lowest data point, it is not likely to be representative of the true CAPE available to a parcel emanating from the PBL. Show me a sounding with a well mixed PBL that still has a dewpoint of 80+F at the surface and I'll be truly impressed. Otherwise I tend to think of observed CAPE values larger than about 6000 J/kg or so as unrealistic.
 
2b5466c430f907d50af71d1a823323e0.gif

August 4, 2008 at 7pm out of NWS Lincoln. The day a rather incredible derecho event swept through Chicago-land and much of Northern IL and IN. Observed MLCAPE of ~8800 J/KG. Dew points this day, I remember well, were into the lower to middle 80s across much of Central Illinois with readings as high as 85 occurring....similar to yesterday. Yes it does get that high around here with so much corn being planted and then taking into factor that summer was record wet, its not too difficult to attain low to mid 80s surface dew points, contrary to popular belief.
 
Jeff makes a good point. In addition, I've noticed that CAPE values are very sensitive to the method used for calculating it numerically and whether you use the virtual temperature correction. I agree, Lincoln, IL is basically the epicenter of the world's most productive agricultural region. It's surrounded by one corn or soy bean field after another. High SBCAPE values are pretty common in central IL when crops reach their peak transpiration period in July. That August 2008 sounding still impressive.
 
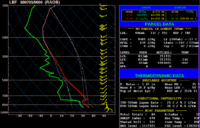
There are different ways to calculate CAPE (and not just those that use the virtual temperature correction vs. those that do not), which makes comparisons between different plotting programs / calculation routines difficult. However, the 00z LBF sounding from 7/3/99 has the highest CAPE "number" I've seen (note that this is virtual T corrected, SBCAPE) at 9485 j/kg. The Tv-corrected CAPE for the same data calculated and shown on the University of Wyoming upper air site is "only" 7746 j/kg.
19990703_0000utc_KLBF_sounding_9485_cape.gif
 
The Tv-corrected CAPE for the same data calculated and shown on the University of Wyoming upper air site is "only" 7746 j/kg.

If the numbers are based on the plotted image above, then that makes no sense unless the value you quoted is an MLCAPE. The virtual-temperature correction lowers the LFC and increases the parcel buoyancy immediately above the LFC (note that the parcel's mixing ratio stays higher than that in the environment over a greater depth, so dTV/dz > dT/dz once you get above the mixed layer). The tv-parcel is never less buoyant than the normal parcel, so that shouldn't be.
 
I think what Jeff S. is saying is that UWYO's sounding archive must be using a different numerical technique for integrating CAPE and that's why it's so different. I've noticed this as well. Many of the soundings I've looked up on UWYO's site calculate out to a much different (usually lower) CAPE than what you see elsewhere.
 
Last edited:
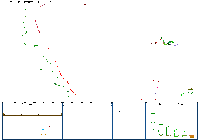
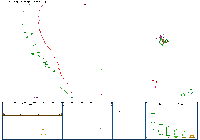
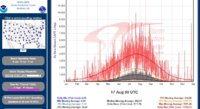
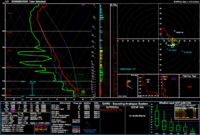
I should make a point that I was using SPC's filtered data field. Raw soundings yielded multiple 10+K SBCAPE values (pic 1), including a sounding from DDC that "measured" 99+K SBCAPE (pic 2), lol. I am unsure how SPC filters their data.

Also, I was unable to find most of the commentators' non-SPC soundings on the climo page. Unfortunately the unregulated CAPE calculations Brain and the Jeff's were alluding to does put an asterisks on this list.

ILX's 7/25/16 00Z does not show up on the climo filtered/raw page though. Not sure why this is the case. LBF's 07/03/99 00Z sounding provided by Jeff S. does rank as overall highest SBCAPE at 9485 shown on this post, but I believe I was able to find it in SPC's raw data although at a close value (~8250).

20160725_HighestCAPE_ILXRawSBCAPE.JPG

20160725_HighestCAPE_DDCRawSBCAPE.JPG
 
Just for kicks, (and to get some more data points on comparison between sounding routines), I ran a couple of the soundings mentioned here through SHARPpy to see what it says. @Ethan Schisler's case is the most interesting.

20080505_00Z_KILX_snd.png

The SBCAPE is very close, but the MLCAPE is ~1200 J/kg lower than the graphic he posted (8873 J/kg on Ethan's graphic vs 7632 J/kg in SHARPpy). I'm not sure what the reason for the difference is, but I believe the SHARPpy output more than I believe the graphic. My main reason is that the graphic doesn't look like the MLCAPE should be greater than the SBCAPE (the mixing ratio in the boundary layer doesn't appear to increase with height). University of Wyoming computes 7535 J/kg, but they never specify whether this is SBCAPE or MLCAPE. It certainly fits more with an MLCAPE value, though.

(A side note: that sounding has an analog to the F5 Plainfield tornado. That illustrates how similar a parameter space derecho events and strong/violent tornado events occupy).

For @Jeff Snyder's case, SHARPpy actually gives slightly higher SBCAPE (9544 J/kg), but for values that high, a 59 J/kg difference is pretty meaningless. For the record, it also gives an MLCAPE of 7122 J/kg for that sounding.

There is a very interesting discussion to be had on errors in the calculation of parameters like CAPE of your favorite parcel. There are probably tons of examples in the scientific literature, but I know @Greg Blumberg has done some preliminary investigation. He found that just from temperature and relative humidity measurement errors on a radiosonde, errors in SBCAPE can be quite large. Almost to the point of rendering the calculation useless in extreme cases. These invariably tend to be low-CAPE profiles, a problem if you're looking at a low-CAPE, high-shear severe weather event. All that is just measurement errors, and not even taking into account that computing CAPE involves numerically solving an ordinary differential equation, which has multiple approaches and can therefore give you multiple answers.

Anyway, I got a little off-topic, but working on SHARPpy has given me an appreciation for how much goes into these calculations that I think a lot of people take for granted.
 
Last edited:
If the numbers are based on the plotted image above, then that makes no sense unless the value you quoted is an MLCAPE. The virtual-temperature correction lowers the LFC and increases the parcel buoyancy immediately above the LFC (note that the parcel's mixing ratio stays higher than that in the environment over a greater depth, so dTV/dz > dT/dz once you get above the mixed layer). The tv-parcel is never less buoyant than the normal parcel, so that shouldn't be.

I think what Jeff S. is saying is that UWYO's sounding archive must be using a different numerical technique for integrating CAPE and that's why it's so different. I've noticed this as well. Many of the soundings I've looked up on UWYO's site calculate out to a much different (usually lower) CAPE than what you see elsewhere.

Indeed. I only have SBCAPE in the image I included, and I only have a single number for "CAPV" from U of Wyoming with no indication about the parcel trajectory used in this latter case. The surface parcel trajectory is shown in the image from U of Wyoming (not shown in my post), but the significant drop in CAPE estimate seemingly implies that UWyo is calculating MLCAPE despite showing the surface parcel trajectory on the image.

I don't know, however, if UWyo is using pseudoadiabatic moist ascent or reversible moist ascent. In addition, I don't know if they are including ice effects (i.e., latent heat of fusion). These unknowns can significantly affect the calculation of CAPE, even if one uses the same starting parcel characteristics (T/Td or Tv). For all I know, UWy is showing SBCAPE but using reversible moist ascent and/or not including the effects of latent heat of fusion whereas the NSHARP sounding may use pseudoadiabatic ascent with latent heat of fusion. I have no clue, though, since those details aren't readily available.
 
Last edited:
I don't know, however, if UWyo is using pseudoadiabatic moist ascent or reversible moist ascent. In addition, I don't know if they are including ice effects (i.e., latent heat of fusion). These unknowns can significantly affect the calculation of CAPE, even if one uses the same starting parcel characteristics (T/Td or Tv). For all I know, UWy is showing SBCAPE but using reversible moist ascent and/or not including the effects of latent heat of fusion whereas the NSHARP sounding may use pseudoadiabatic ascent with latent heat of fusion. I have no clue, though, since those details aren't readily available.

I think UWyo shows the MLCAPE for the lowest 50 mb, based on comparing the output of the RAOB program for different pressure intervals for MLCAPE with the values from UWyo.
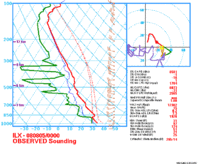
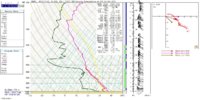
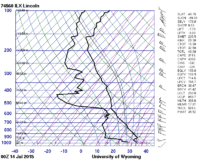
Below is the 00Z sounding from ILX at July 14, 2015, which gives a very large difference for different CAPE types, with (in RAOB, with virtual correction) a SBCAPE of 6687 J/kg, a 50 mb MLCAPE of 3443 J/kg and a 100 mb MLCAPE of 1027 J/kg. UWyo gives a CAPE value of 3358 J/kg for this case, very close to the value from RAOB for the 50 mb parcel.

Regarding the topic; I have also attached the 12Z-sounding from Calcutta, India from May 13, 1996, for which RAOB gives a MLCAPE (50 mb) of about 8600 J/kg. This is the day at which (violent) tornadoes struch Bangladesh, killing hundreds of people (http://reliefweb.int/report/bangladesh/bangladesh-tornado-24-may-1996-information-bulletin-no3). Those tornadoes developed however north of Dhaka, which is more than 300 km away from Calcutta.

2015-07-13,_00Z,_ILX.JPG 2015071400.74560.skewt.parc.gif 1996-05-13,_CALCUTTA,_INDIA.JPG
 
Having not looked into any of the code myself, I'm curious if anyone has a summary. Are the CAPE calculation differences between various sources due more to a) different trajectory assumptions or b) different numerical techniques?
 
Having not looked into any of the code myself, I'm curious if anyone has a summary. Are the CAPE calculation differences between various sources due more to a) different trajectory assumptions or b) different numerical techniques?

I think it's both 1) differences in calculation of source parcel characteristics and 2) differences in lapse rates used to determine parcel path. There should not be any significant differences between integration schemes. Anyone who knows what they're doing should be using the Trapezoidal Rule to compute the integral.
 
Back
Top