Detection and documentation of brief, weak tornadoes is way up in recent decades,
and it keeps improving every year.
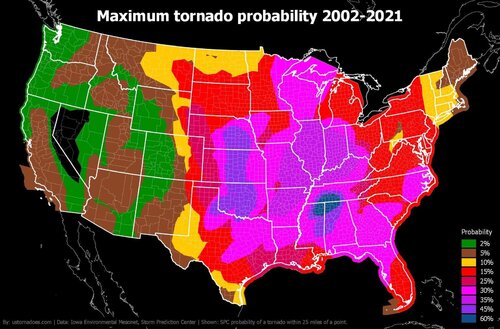
Look at this U.S. tornado max probability map for 2002-2021 (attached). You can see
higher probabilities have definitely shifted more E.
But it is a bit misleading. I don't think the shift is as big as some think. It is just
that, again, detection is so much better now, and with the higher population E of
the Plains and just more objects to hit to reveal a tornado occurred, more tornadoes
were inevitable. These brief tornadoes were likely always there.
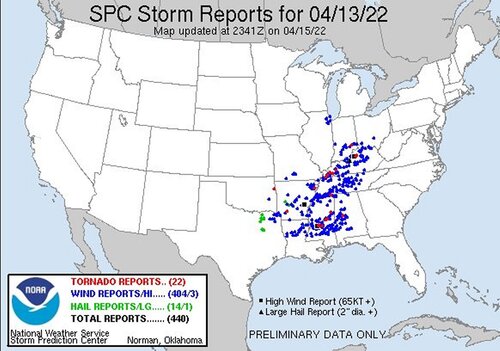
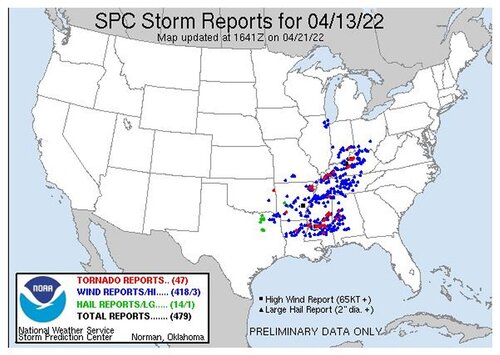
What I have seen in recent years is a significant increase in QLCS tornadoes.
Days with a raging squall line in the MS Valley or the Southeast, initially on
the SPC svr plot, you will see a ton of blue dots for wind reports, and often not
many, or no, tornado reports (red dots). Wait a few days, and I've seen it go from
nothing to 20+ confirmed tornadoes after surveys are done with red dots all
over SPC svr plot for that same day. The vast majority of QLCS tornadoes are
weak, even a bigger majority than discrete supercell tornadoes.
Squall lines were once thought to be poor tornado producers, but that's only
because we lacked the technology to detect them. Now with Level 2 WSR-88D
data, MESO-SAILS mode, and TDWRs, it is much easier to verify these brief
tornadoes, and the NWS can focus on damage reports where rotation was detected
on radar at the time. Plus, social media and cameras everywhere assist greatly in
the better detection and documentation of tornadoes. I recall reading some years
ago that 18% of all U.S. tornadoes were produced by squall lines. I bet that
percentage is considerably higher than that now.
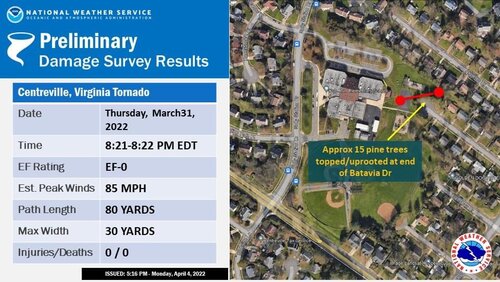
Even with discrete supercells, detecting brief tornadoes has come along
way. Look at this very brief tornado that occurred in Centreville VA on 3/31/22
(storm report graphic attached).
It was likely not on the ground for more than 5 sec and traveled only 80
yards. Tree damage occurred, but prior to the WSR-88D and social media,
it is unlikely this would have been documented as a tornado and just
listed as straight-line tstm wind damage.
It makes you wonder how many of these brief tornadic spin-ups actually
occur every year across the U.S. that we still never detect and document due
to remoteness or lack of damage indicators. I bet there are hundreds. The
30-year average annual tornado number in the U.S. is currently about 1200,
but I bet it is actually closer to 1500, especially when you consider the vast
remote areas in the Plains and Rockies.
And one other item, is this tornado shift E really that much more of an overall risk?
Violent U.S. tornadoes show a solid downward trend whether you start in 1950,
1975 (Fujita scale adopted), or 2007 (F to EF scale). So more tornadoes overall
further E, but the overall intensity is decreasing. 100 weak, brief tornadoes don’t
even come close to the impact compared to just one violent, long-tracked tornado
given the same population area.