• While Stormtrack has discontinued its hosting of SpotterNetwork support on the forums, keep in mind that support for SpotterNetwork issues is available by emailing [email protected].

Questions about Tphigram

  • Thread starter Thread starter Ashwin D
  • Start date Start date

Ashwin D

Hello,
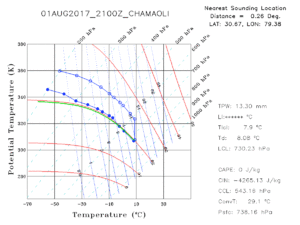
I have this Tphigram and I have read this document - https://courses.eas.ualberta.ca/eas370/The-Tephigram.pdf but it is not instantly clear whether this sounding reveals impending rainfall or not. Can somebody with experience in interpreting T phi grams explain the blue , green and red lines ? I understand CAPE or CIN is not favorable and I understand what LCL means as well. But the blue, green and read line seem a bit opaque.
Can somebody explain it out ?

Regards,
Ashwin.
 

Attachments

  • CHAMAOLI.gif
    CHAMAOLI.gif
    29.2 KB · Views: 2
I'm used to looking at SkewT diagrams to example atmospheric soundings, and am no expert on tephigrams, but the blue line with open circles is the temperature of the environment as one moves up in the atmosphere. The blue line with the closed circles is the dewpoint of the environment. The red lines are the pseudo saturated wet adiabats that saturated parcels of air would follow as they rise. The green line is the temperature a surface parcel from this sounding would have as it rises through the atmosphere, in this case it follows a pseudo saturated wet adiabat from the surface up to 200 mb since the surface parcel is saturated. As to whether this sounding indicates impending rainfall or not, I would think one would have to know more than just this sounding to infer that. What might cause the lifting in the atmosphere that would be needed for the rainfall? Would there be additional moisture advected in through time to increase the chances, etc.?
 
Last edited:
Stick to Skew-Ts or Stuve plots (both of which can be found for observed soundings at http://weather.cod.edu/analysis/ (look under Upper Air soundings). I don't know anyone in operational forecasting, research, or academia that uses a Tephigram for anything other than introductory physics classes.
 
I'm used to looking at SkewT diagrams to example atmospheric soundings, and am no expert on tephigrams, but the blue line with open circles is the temperature of the environment as one moves up in the atmosphere. The blue line with the closed circles is the dewpoint of the environment. The red lines are the pseudo saturated wet adiabats that saturated parcels of air would follow as they rise. The green line is the temperature a surface parcel from this sounding would have as it rises through the atmosphere, in this case it follows a pseudo saturated wet adiabat from the surface up to 200 mb since the surface parcel is saturated. As to whether this sounding indicates impending rainfall or not, I would think one would have to know more than just this sounding to infer that. What might cause the lifting in the atmosphere that would be needed for the rainfall? Would there be additional moisture advected in through time to increase the chances, etc.?
Thank you GPhillips and Jeff. Most informative.
 
I'm used to looking at SkewT diagrams to example atmospheric soundings, and am no expert on tephigrams, but the blue line with open circles is the temperature of the environment as one moves up in the atmosphere. The blue line with the closed circles is the dewpoint of the environment. The red lines are the pseudo saturated wet adiabats that saturated parcels of air would follow as they rise. The green line is the temperature a surface parcel from this sounding would have as it rises through the atmosphere, in this case it follows a pseudo saturated wet adiabat from the surface up to 200 mb since the surface parcel is saturated. As to whether this sounding indicates impending rainfall or not, I would think one would have to know more than just this sounding to infer that. What might cause the lifting in the atmosphere that would be needed for the rainfall? Would there be additional moisture advected in through time to increase the chances, etc.?
GPhillips - what you are saying is that if sufficient horizontal advection of moisture happens in reasonable time then chances increase even though CAPE and CIN are unfavorable. Am I correct in saying that ?
 
I'm just saying that the sounding by itself does not look close to saturation, except at the surface. So there doesn't appear to be anything impending. A source of lift would be needed, and additional moisture would increase the chances if a source of lift arrives. The sounding by itself doesn't tell me that precip is imminent. One needs to know more. If the sounding showed potential instability with little or no inhibition, and heating was occurring, some small forcing for lift might set off convection, but one doesn't see that in this sounding. Temperatures increasing at low-levels and increasing moisture would create some potential instability, but there still needs to be something to lift the low-level parcels to realize that potential.
 
GPhillips- Many thanks. Final question on Tephigram. Am I right that the numbers across the 600 hPa isobar line are saturation mixing ratios ?

If that is the case what are the numbers 0 10 20 30 40 50 across the 1000 hPa isobar line ?
 
Yes on the first question. On the 2nd question, the numbers near the 1000 hPa line are labels for the pseudo saturated wet adiabat lines.
 
OK those numbers labeling the pseudo saturated adiabat lines do not represent any measures - they might as well be labeled anything ?
 
Back
Top