Plotting Storm Motion on a Hodograph

Joined
Oct 15, 2015
Messages
50
Location
Calgary, Canada
Determining storm motion is relatively easy when you can observe it in real time, however, it becomes trickier when forecasting it. SRH (Storm relative helicity) is highly sensitive to where storm motion is plotted, so greater accuracy for its placement yields more realistic progged SRH values.

What is the best way to estimate where to plot storm motion? The halfway point on the mean shear vector? A possibly painstaking average of all u and v coordinates? Using the 700mb plot as a proxy? The approximate speed and direction from the "Storm Motion" product on twisterdata? Placement looks relatively straightforward on a perfectly clockwise looping or straight line hodo, but these things are seldom perfect, ya know?

Also, in the same vein, in order to generate forecasted SRH values, a model must have storm motion plotted on a hodograph. How is that determined?
 
The current standard for estimating deviant motion is the Bunkers method: http://www.weather.gov/media/unr/soo/scm/BKZTW00.pdf

In lesser sheared flows or in situations where storms are not expected to be particularly well organized, the storm motion vector is best estimated using the mean wind vector in the cloud bearing layer, typically between about 850 and 250 mb. Some people weight by mass (pressure); some don't. Errors caused by that factor are generally small enough to ignore relative to total error. This motion vector can be somewhat easily eyeballed if looking at a hodograph as just the geographic mean location of all the winds in the storm depth layer.

Keep in mind that SRH has a pretty complicated mathematical definition. It is not something you are going to be able to calculate easily just by looking at a hodograph. You really would need a computational method to have solid numbers to look at. I wouldn't try to burden yourself with getting even decent estimates just from looking at a hodograph.
 
From the Bunkers et al article, to sum up how to estimate deviant motion, we:

- Plot the 0-6km mean wind (non-pressure weighted)
- Draw the vertical wind shear vector, from a point between 0-0.5km to between 5.5-6km
- Draw a line that intersects the mean wind at 90 degrees to the vertical wind shear vector
- Plot the RM at 7.5m/s to the right of the mean wind along said line, and the LM at 7.5m/s to the left

This is all good if we know where to plot mean wind. This was what I originally meant by "storm motion", as opposed to "deviant motion." Apologies for being unclear. I guess there is no really easy way to do this without a lot of computational power, especially for really complicated hodographs?

In the Meted module, "Principles of Convection II: Using Hodographs," I understood that convective storms tend to originally move along or advect with the mean wind (and this would be the point from which SRH would be determined - in the areas swept out between it and the 0-1km and/or 0-3km storm relative wind vectors), before deviant motion may occur (due to internal dynamics in the supercell). They offered a coarse way to determine the mean wind, by averaging the u and v coordinates at certain intervals (0.5km or 1km). This would clearly be far from simple or practical in most real world cases.

Does the SHARPpy software automatically plot mean wind? If so, is it determined by pressure weighting, or simply height?

Also, the magnitude of SRH is assumed when the storm is moving along with the mean wind. But once it deviates, the "storm motion" plot would move on the hodograph, and the storm would therefore begin ingesting air with a different (more or less) SRH magnitude, correct?
 
In the Meted module, "Principles of Convection II: Using Hodographs," I understood that convective storms tend to originally move along or advect with the mean wind
Yes, this is a good estimate of storm motion for storms that are not expected to move in a deviant manner.
(and this would be the point from which SRH would be determined - in the areas swept out between it and the 0-1km and/or 0-3km storm relative wind vectors)
In theory, there is no problem with this, but in practice, SRH is pretty much always calculated assuming deviant motion is occurring.

Also, the magnitude of SRH is assumed when the storm is moving along with the mean wind. But once it deviates, the "storm motion" plot would move on the hodograph, and the storm would therefore begin ingesting air with a different (more or less) SRH magnitude, correct?

See note above. Yes, SRH is a function of the actual storm motion, but again, forecasts of SRH almost always assume the storm is following the Bunkers method deviant motion.
 
Does the SHARPpy software automatically plot mean wind? If so, is it determined by pressure weighting, or simply height?
SHARPpy plots the pressure-weighted mean wind between the lifted condensation level (LCL) and equilibrium level (EL) as a brown box on the hodograph.

Example (from the 4 km NAM forecast for Childress, TX at 23Z tomorrow, 11-16):
Screen Shot 2015-11-15 at 11.35.34 PM.png
The mean wind is 218/54.
 
@Tim Supinie, cool! Is there any way to tell what height any point of that hodograph is, by clicking on it somewhere or something?

Also, on a side note, what would cause that backing in the mid levels there? Cold advection into that layer? If so, how detrimental could this be to the development of supercells? Not only would cold advection cause subsidence at this level, but could the backing wind (being where it is even "beneath" the mean wind) there be enough to disrupt the generation of a mesocyclone?

Back to the point, I wonder which method SHARPpy uses to calculate mean wind. Until now I've only read about the height-based Bunkers/ID method and the pressure weighted method proposed by this paper, which seems similar:

http://www.nwas.org/jom/articles/2014/2014-JOM11/2014-JOM11.pdf

The above proposes to use the effective inflow base as the bottom (often at the ground, but can also be at some level aloft - useful for elevated storms) and 65% of the most unstable equilibrium level as the top (also helpful in calculating a more accurate mean wind in low-topped storms).
 
Is there any way to tell what height any point of that hodograph is, by clicking on it somewhere or something?
That's something we haven't added yet, for one reason or another. One thing I'd like to do is to make some changes to the mechanics of interacting with the hodograph, so this can be one thing I update.

Also, on a side note, what would cause that backing in the mid levels there? Cold advection into that layer? If so, how detrimental could this be to the development of supercells? Not only would cold advection cause subsidence at this level, but could the backing wind (being where it is even "beneath" the mean wind) there be enough to disrupt the generation of a mesocyclone?
Yeah, anecdotally, I see the veer-back-veer issues in profiles close to the trough axis, which could be reflective of the CAA at mid-levels associated with the trough. Which one causes the other (does the backing cause the retrieval to suggest CAA or is the backing really caused by CAA) I'm not sure of.

As for how it affects a mesocyclone, in its most extreme forms I've seen profiles that greatly favor left-movers over right movers. But the most common situation can be roughly, and perhaps over-simply, explained like this: the bottom half of the storm wants to be a right mover and the top half wants to be a left mover. The tangible effect is it has a lot of trouble getting organized. It might eventually become one or the other, but that takes a while, and it might run out of instability by then. The hodograph I posted earlier is not even that extreme; it still favors right movers with decent(-ish) storm-relative winds at all levels.

Back to the point, I wonder which method SHARPpy uses to calculate mean wind. Until now I've only read about the height-based Bunkers/ID method and the pressure weighted method proposed by this paper, which seems similar:

http://www.nwas.org/jom/articles/2014/2014-JOM11/2014-JOM11.pdf
I think you might be mixing up terms here. When you ask how SHARPpy computes the mean wind, I think you mean the storm motion vector. To compute the mean wind, it's essentially what I outlined in my previous post. For the storm motion vector, I believe it's the method described in the paper you linked.
 
Last edited:
I think you might be mixing up terms here. When you ask how SHARPpy computes the mean wind, I think you mean the storm motion vector. To compute the mean wind, it's essentially what I outlined in my previous post. For the storm motion vector, I believe it's the method described in the paper you linked.

Actually I was asking how SHARPpy computes the mean wind, and indeed you did answer it above. It would appear that it is in fact a different method than the other two I have listed above, which are the height-based default Bunkers method (0-6km, based on the average of all u and v coordinates), and the method proposed above in the paper I posted which suggests a better way to calculate mean wind (from which deviant motion can then be estimated, also by Bunkers et al), which is pressure weighted (between effective inflow base and 65% MUEL).

So as you said, SHARPpy uses a pressure weighted method essentially in the cloud layer, between the LCL and EL (slightly different than what article above proposes), and is similar to what Jeff suggested about a pressure weighted method between roughly 850mb and 250mb. All ways are slightly different but apparently the effect it has on an accurate estimation of deviant motion isn't very much (though a purely height based method seems to me somewhat inferior as it may be less representative of the real environment, ie if there are elevated storms etc). It's kind of like the difference between using the 0-6km bulk shear and the EBWD.
 
I'll throw in the variable of "early storm height" as a factor. When high 0-6km shear speeds, with more directional veering at the tropopause, storms often don't really make 300mb until way down stream. So these storms often move more, well, 'backed' when starting. You see a lot of good days with initial storm vectors of like 190@40, then it gets mature and goes 210@40. Might even speed up a smidge. But then goes supercell, spins, and it'll wind up as 220@35 if not 230@30. Grinders. I think they get attached to the surface. Literally, and bad pun-wise.
 
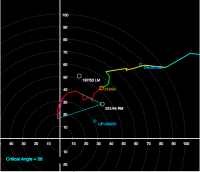
Hi Kyle. You asked how Storm Motion is drawn. Here is an example showing how it is done with RAOB >

RAOB also lets you fully control associated parameters, such as the Storm-Motion method, Mean Wind depth, Helicity layers, and others as seen here >

Note that RAOB's full-screen Hodograph is graphically interactive (as seen in the above videos). This interactive Hodograph is great for "what-if" scenarios and educational purposes. These features and other functions can be freely experienced using the RAOB Reader program > http://raob.com/raobreader.php
 
A really "easy" old rule of thumb I remember uses 75% of the 700 hPa wind magnitude and veer 30 degrees of the 700 hPa wind direction for a RM supercell.
 
Back
Top