IDENTIFYING SHORTWAVES ON SATELLITE IMAGERY

Joined
Oct 31, 2013
Messages
496
Location
Eastern TX Panhandle
So, I've been forecasting for many years, but one of my downfalls/weaknesses is identifying features on satellite pertaining to severe weather. Using this link below which is my favorite satellite site along with the COD site, can any of you help me identify which particular satellite to use, and how to best identify shortwaves and other various features for severe weather? Thank you in advance to anyone who's willing to help out. If you have a better satellite page that you like, please include that if you want!

GOES IMAGE VIEWER: Southern Rockies
 
Hi Jason, I think there was an excellent discussion about this on ST back in 2008.


I know the one that produced my Twister image back in 1994 was seen as a very brief, faint line of clouds for one satellite image frame heading towards the Texas Panhandle by a sharp-eyed met. in Topeka who made a note in his discussion, keeping me there.
 
Yeah @Warren Faidley ... that link was more on finding them on maps which I know how to do. I was just wondering if anyone could point me in the right direction on how to find shortwaves with the satellite link I posted. I'm guessing the mid and upper level water vapor imagery, but not positive.
 
@Warren Faidley...I do want to thank you for pointing out that link. I scrolled down and found that post from Robert Prentice talking about the 700-400mb differential vorticity advection on the SPC mesoscale analysis page. I guess I can look at this graphic every day and find the highest blue contours, then look at mid and upper level water vapor imagery and see what the interest area looks like. Since retirement, I have a lot of time on my hands! Getting ready for those sneak attack days and secondary target areas!
 
Back in the day (before laptops), when we had access to high resolution radar at NWS offices, we would continually watch the screen for any hint of even the faintest jet streak moving towards the southern Plains. Sometimes, it was like magic when it hit the dryline.
 
Yes, I've been watching some tutorials today on shortwaves. Some of the examples were crazy when they would come in and hit the dryline! Like you said...MAGIC!
 
I’ve came close on a few occasions of starting this very thread, along with identifying residual outflow boundaries I sometimes struggle identifying shortwaves even after given the location by a forecaster. I’ll do my analysis and think I have a good understanding of the state of the atmosphere, go to the SPC and read about a shortwave trough that escaped my detection…“Water Vapor Imagery shows a subtle shortwave over…” and when I check an image ( COD NEXLAB: Satellite and Radar ) ( Satellite page: RAP Real-Time Weather ) for that time or do a loop sometimes I see it, sometimes I think I see it but other times to my eyes it’s just not there. I’ve been tempted to capture an image in one of those instances and post it here and ask for help but then I don’t want to show ignorance so I just forget about it. Thanks @Jason Boggs for bringing this topic up again and @Warren Faidley for the link to the previous discussion, to be honest the post directly answering the satellite question still leaves me lacking the understanding I need but the post on differential vorticity advection was very helpful as well as the info at the link above posted by @Randy Jennings.
 
Visible satellite trends are your best source for nowcasting in the 1-4 hour time frame. But using the water vapor imagery helps identify small scale waves/speed maxes that may be the trigger mechanism to get convection started. I look for a small streak of cirrus that has shows some bowing/fanning out/inflection point with a darkening horizontal band behind it indicating a small scale speed max propagating through the mean flow.
 
So, I've been forecasting for many years, but one of my downfalls/weaknesses is identifying features on satellite pertaining to severe weather. Using this link below which is my favorite satellite site along with the COD site, can any of you help me identify which particular satellite to use, and how to best identify shortwaves and other various features for severe weather? Thank you in advance to anyone who's willing to help out. If you have a better satellite page that you like, please include that if you want!

GOES IMAGE VIEWER: Southern Rockies
Jason, here is a link to a page from NESDIS explaining the function of all the different Bands on the GOES 16 ABI.
GOES-R Band Plan

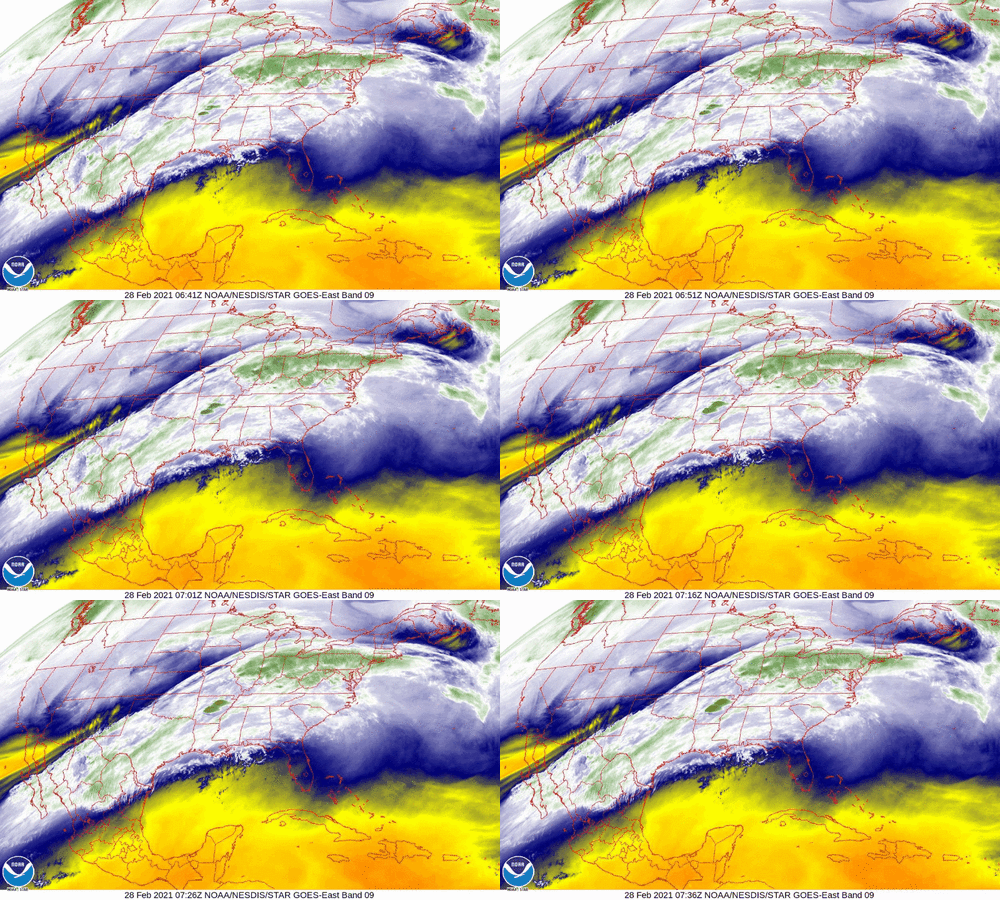
As for identifying shortwaves, you are correct in that you want to be looking in the mid- high water vapor IR bands. These go from roughly 600mb to 300 mb and give the best overall view of the mid-level jetstream and troughs. The key to finding shortwaves is looking for discontinuities in the background flow and looking for jet streaks. Its very rare for the atmosphere to be in such perfect harmony that a slug of air 1000s of miles long is moving perfectly straight. Finding the ripples, swirls, and kinks (usually easiest along the northwest side of the jet stream) is one way to find shortwaves. Even with relatively straight line southwesterly flow, interactions with the Rockies in the lower atmosphere will result in the development of shortwave troughs downstream. Thus, you can look for an area where the form preferentially. Watching a WV loop a couple of times you can start to pick out swirls and features indicating subtle shortwaves. The other area to look for is near the nose of jet streaks. Again due to complex dynamics, (differential vorticity advection, temperature advection, stretching, ect...) changes in flow speed can result in subtle height falls and thus, shortwaves.

All in all its just practice. Looping is probably the biggest help. Discontinuities will start to pop out the longer you stare at a loop.
Theres a decent example of a shortwave trough tonight across the eastern Dakotas and a very subtle one across New England. Another subtle wave in the subtropical jet across Missouri into the Ohio River valley. Not to mention the very classic signature over western Nova Scotia.

And just a side note about shortwave troughs. There's a common misconception that the lift from these features is responsible for firing up storms. Thats not true. Troughs and synoptic ascent pre-condition the atmosphere for convection by steepening lapse rates and decreasing inhibition. Even the strongest troughs only produce lift on the scale of centimeters/second. The average dryline circulation has vertical velocities well over a meter/second! (aka ~100x as much from a trough). So dont think of these as magic bullets for spring dryline storms, they certainly help, but they arent everything.


G16_conus_band09_12fr_20210228-0241.gif
 
Back
Top