Air Mass Thunderstorms

Tom Mull

EF0
Joined
Apr 14, 2011
Messages
41
Location
Wildwood, MO
Of all the types of storms to observe, my favorite type are air mass storms that pop-up on hot summer afternoons. Unfortunately, I have been able to find very little info on predicting such storms.

Does anyone know of any good information for techniques for predicting air mass storms? Thanks for any help.
 
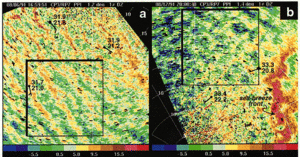
Those kinds of storms are the most difficult to predict since there aren't distinct mesoscale features like boundaries to trigger storms, and it comes down to small-scale processes. Take a look at this image produced by a highly sensitive radar (on NEXRAD you'd see very little) where the large box is. Areas of weak colors are probably downward motion (relatively clear air from aloft sinking), and areas with strong colors are where it's rising, with thermals bringing scatterers of radar energy (often bugs and perhaps small bits of debris picked up by the wind) to higher levels. All of this is moving with the mean winds, too. The atmospheric motion on a sunny summer day in your county looks a lot like what these images show. So this gives you some idea of the difficulty predicting exactly where a storm is most likely to might pop up.

431f6793a87664fea7e6065062489fbb.gif

So it pretty much comes down to the basics... you look at all the available data and try to find where there's the highest dewpoints and temperature, where there's the best convergence of the wind field, and the most favorable, uncapped conditions aloft. You'd look for any boundaries left over from yesterday's storms... that's a very important clue. Hand analysis, careful use of radar overnight, and high-res visible satellite images really help here (and this is where GOES-16 really shines). And you would consider interaction of the atmosphere with local topography, like the Caprock if you're a Lubbock forecaster. In tropical climates, storms often prefer to form over rivers and marshland instead of boundaries, as that's where the fuel is. If you want, you can look at high resolution models like this 3 km NAM run. But this would be mostly for fun... the models just can't handle the smallest scale details because the average surface observation spacing in the US is about 50 miles every 20 minutes, which kind of puts a practical limit on how precise these forecasts can be.

Now once these "air mass" storms are underway, you can sometimes get an idea where new storms will pop up by anticipating the location and movement of boundaries and updraft towers relative to the first storm. Where the mean low-level wind flow impinges on the outflow boundary is a favored area for additional development. But if the air mass is relatively uncapped, which is common in the middle of summer, new storms just develop randomly along the outflow and soon you're looking at 20 or 30 cells.
 
Last edited:
I sometimes think that, despite the inherent reasons Tim mentions above, *sometimes* forecasting such thunderstorms here in the UK can actually be relatively easy. Being an island, with marked hill and mountain ranges, there are certainly preferred areas of low-level forcing, which are well known. Despite being weaker than the (occasional) well-organised storms we get from larger-scale upper troughs/low-level warm advection regimes, these can actually be easier to forecast!
 
Those kinds of storms are the most difficult to predict since there aren't distinct mesoscale features like boundaries to trigger storms, and it comes down to small-scale processes. Take a look at this image produced by a highly sensitive radar (on NEXRAD you'd see very little) where the large box is. Areas of weak colors are probably downward motion (relatively clear air from aloft sinking), and areas with strong colors are where it's rising, with thermals bringing scatterers of radar energy (often bugs and perhaps small bits of debris picked up by the wind) to higher levels. All of this is moving with the mean winds, too. The atmospheric motion on a sunny summer day in your county looks a lot like what these images show. So this gives you some idea of the difficulty predicting exactly where a storm is most likely to might pop up.

View attachment 15448

So it pretty much comes down to the basics... you look at all the available data and try to find where there's the highest dewpoints and temperature, where there's the best convergence of the wind field, and the most favorable, uncapped conditions aloft. You'd look for any boundaries left over from yesterday's storms... that's a very important clue. Hand analysis, careful use of radar overnight, and high-res visible satellite images really help here (and this is where GOES-16 really shines). And you would consider interaction of the atmosphere with local topography, like the Caprock if you're a Lubbock forecaster. In tropical climates, storms often prefer to form over rivers and marshland instead of boundaries, as that's where the fuel is. If you want, you can look at high resolution models like this 3 km NAM run. But this would be mostly for fun... the models just can't handle the smallest scale details because the average surface observation spacing in the US is about 50 miles every 20 minutes, which kind of puts a practical limit on how precise these forecasts can be.

Now once these "air mass" storms are underway, you can sometimes get an idea where new storms will pop up by anticipating the location and movement of boundaries and updraft towers relative to the first storm. Where the mean low-level wind flow impinges on the outflow boundary is a favored area for additional development. But if the air mass is relatively uncapped, which is common in the middle of summer, new storms just develop randomly along the outflow and soon you're looking at 20 or 30 cells.

Tim,

Thanks for the response. Are they graphics for the NEXRAD radar available anywhere on the internet?
 
The best place to watch air-mass thunderstorms is over tropical waters. They can be quite beautiful from the air. I always recall seeing lots of airmass CBs flying from Miami, USA to San Jose, Costa Rica during the warm/wet season. Over the water they don't really favor any particular time of day. They're just always there, bubbling up from time to time.
 
Thanks for the response. Are they graphics for the NEXRAD radar available anywhere on the internet?

Those graphics I posted are from research radars operating at different wavelengths (not well suited for general forecasting). There's actually some cool images that are even better which show the circulations in the Denver convergence zone area, as part of a research experiment that was done there about 5-10 years ago, but I was not able to find those graphics much less remember where the experiment was from.

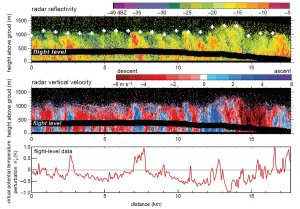
However below is another cool example of all the small-scale circulations taking place in the atmosphere on the day of a field experiment. This was taken by a 4 mm (W-band) radar, much MUCH different from NEXRAD. This shows the lowest 4000 ft of the atmosphere, in late May, just after noon, in the Oklahoma Panhandle. This is a clear day and you are seeing mostly tiny insects on these images! More info: http://journals.ametsoc.org/doi/abs/10.1175/JTECH1699.1


adb8458f0e920f74ebe863ccf32a4ced.jpg
 
Those graphics I posted are from research radars operating at different wavelengths (not well suited for general forecasting). There's actually some cool images that are even better which show the circulations in the Denver convergence zone area, as part of a research experiment that was done there about 5-10 years ago, but I was not able to find those graphics much less remember where the experiment was from.

However below is another cool example of all the small-scale circulations taking place in the atmosphere on the day of a field experiment. This was taken by a 4 mm (W-band) radar, much MUCH different from NEXRAD. This shows the lowest 4000 ft of the atmosphere, in late May, just after noon, in the Oklahoma Panhandle. This is a clear day and you are seeing mostly tiny insects on these images! More info: http://journals.ametsoc.org/doi/abs/10.1175/JTECH1699.1

Wow, so there are measured vertical velocities of 3,4,5 m/s in the PBL on these days? I thought it was excessively rare for |w| to exceed 1 m/s.
 
Back
Top