Danny Neal
EF5

Was reading the other discussion about how implementing %'s when predicting snowfall may be more user friendly to the public. I thought about what other products use %'s (other than the general 40% chance of rain) and thought about the SPC outlook/watch probabilities. This is not a general tool for the public, meaning they probably don't type in www.spc.noaa.gov to view these products, so my question is based towards those in the business. I was wondering the accuracies of these percents and would like to open up a discussion about it.
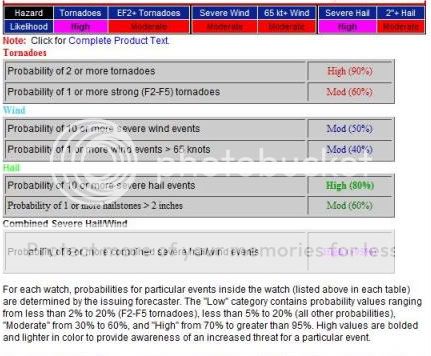
First, how does one determine the percents? In the figure I posted above, there is a 90% chance of 2 or more tornadoes. Which I figure is a 9 out of 10 chance that 2 or more tornadoes will occur. How do you figure that out? Gut feeling? Hail was 80% so an 8 out of 10 chance that 10 or more severe hail reports will be received. Is this based on model data, real-time meso-scale analysis, other? Not being critical in any way, just curious.
I am kind of savvy about how the outlook probabilities work as its over a much larger area, but was wondering how they narrow down specifics....
Again, not trying to bash or condemn or be critical, just curious on the processes involved.
First, how does one determine the percents? In the figure I posted above, there is a 90% chance of 2 or more tornadoes. Which I figure is a 9 out of 10 chance that 2 or more tornadoes will occur. How do you figure that out? Gut feeling? Hail was 80% so an 8 out of 10 chance that 10 or more severe hail reports will be received. Is this based on model data, real-time meso-scale analysis, other? Not being critical in any way, just curious.
After this is determined and the event has occurred, has this information been logged? Have accuracies been published? Would they be published under the accuracy of that forecaster or of the SPC in general?For each watch, probabilities for particular events inside the watch (listed above in each table) are determined by the issuing forecaster. The "Low" category contains probability values ranging from less than 2% to 20% (F2-F5 tornadoes), less than 5% to 20% (all other probabilities), "Moderate" from 30% to 60%, and "High" from 70% to greater than 95%. High values are bolded and lighter in color to provide awareness of an increased threat for a particular event.
I am kind of savvy about how the outlook probabilities work as its over a much larger area, but was wondering how they narrow down specifics....
Again, not trying to bash or condemn or be critical, just curious on the processes involved.
Last edited by a moderator:
