Boris Konon
EF4
Interesting you mention 1976-77 as being a snow drought. Well, that winter was absolutely epic for cold and snow in the eastern U.S.For a great overview of current drought conditions, including some crazy stats (95% of stations in Colorado are in snow drought), see a recent Drought.gov article posted on February 5th:
Snow Drought Current Conditions and Impacts in the West | February 5, 2026 | Drought.gov
For a TLDR of everything I'm about to say, please see this excellent post by the Colorado Climate Center: How does this year compare to the snow droughts of the past? - Colorado Climate Blog
2025-2026 Winter Comparison With History
I mentioned in my first post on this thread that the period of record used to generate most of the scary graphs above only stretches back to 1987. When talking about climatology, this isn't a very long period of record, and also has the affect of possibly making this year look worse than it actually is. I've mentioned that we're experiencing "record" low snowpack, but of course the period of record (POR) for SNOTEL automated snow observations is only 39 years long.
I've seen a number of comparisons recently between this winter and the huge, historically significant winter droughts of 1976-1977 and 1980-1981. Those years fall just outside of the POR for most SNOTEL stations, and so they don't show up on the statewide SNOTEL graphs seen above. So, I'd like to examine how comparable our current winter is to those dry winters of old.
There weren't any SNOTEL stations in Colorado for the winter of 76-77, but a few locations had them for the winter of 80-81. Using data from these individual stations, we can see that at most stations the current snowpack is actually a lot better than in 1980-1981, which was probably the worst snow year in modern history. Vail Mountain is an exception, and at that location this winter is currently worse than 1980-1981.
View attachment 28529
View attachment 28530
I guess this is good news in that the current conditions aren't really unprecedented, and that similar scenarios have played out in the past. However, I think it's noteworthy that Lake Mead and Powell weren't completely drained before the winters of 76-77 and 80-81, so they were able to absorb the hit from low runoff. We're not in a similar position today, and the reservoirs are both already near the level at which power generation becomes much less efficient or stops entirely, and inputs from snowmelt aren't expected to be particularly large this summer.
The Colorado Basin River Forecast Center puts out monthly presentations examining the snowpack situation and predicting runoff. Their most recent presentation, from February, can be found at the following link: https://www.cbrfc.noaa.gov/present/2026/cbrfcwsupfeb2026.pdf
It's pretty grim, and we might be in serious trouble this summer if things don't change.
Snow Course Markers
I recently discovered (through the Colorado Climate Center) that there's a network of manual snow observation sites across the Rockies that has been operational since the 1930s. Observations of snow water equivalent and snow depth are taken once monthly in February, March, April, and May. In select locations this network has a 90+ year record of mountain snowpack, and more broadly it spans 50-80 years, giving us a much more complete picture of historical snowpack than the recently introduced SNOTEL stations.
So, how does this winter stack up to other dry winters over the past 90 years? At almost all snow course stations in Colorado, the lowest SWE values in a 50-90 year history were recorded during the winter of 1980-1981, followed closely by the winter of 1976-1977. A few locations across southern CO have all-time low records during 2000 or 2017. Only a few stations have recorded their lowest SWE for February in 2026.
View attachment 28531
The picture is a little different in other areas. In New Mexico and Arizona, there are a number of "worst years" at each site, probably because values of 0 were recorded multiple times.
View attachment 28532
To the north, it appears that 1976-1977 was particularly bad, followed by 2023-2024 in some areas.
View attachment 28533
You can check out this data for yourself at the following link: NWCC iMap
The takeaway from all of this?
This year is definitely bad, but similar snow droughts have occurred in the past. However, the dry winters of 1976-1977 and 1980-1981 were sandwiched between a number of wet years. Reservoir storage was at acceptable levels before these dry winters happened, allowing their negative effects to be mitigated. We don't have that luxury this year, as reservoirs west-wide are already nearing record low conditions.
In the following graph, note the greatly reduced frequency of wet periods after 2000, and the increasing consistency of droughts. (Graph from NCEI's Climate at a Glance Climate at a Glance | National Centers for Environmental Information (NCEI))
View attachment 28534
In comparison to 1977 and 1981, I believe that this winter's snow drought impacts will be made much worse by the fact that the west is already experiencing drought conditions, and essentially has been for 25 years.
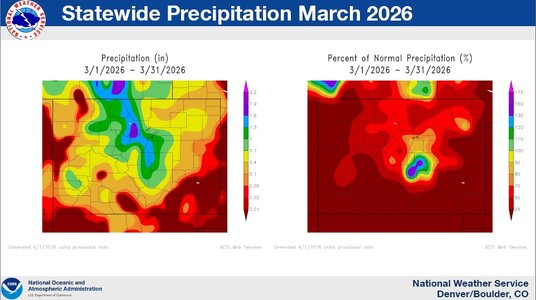
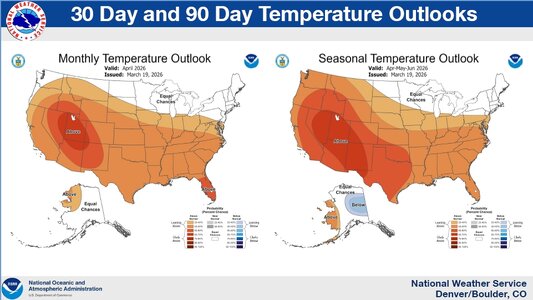
Additionally, it's very interesting to note that all of this is not a consequence of low precipitation. This winter has been marked by above-normal precipitation mostly everywhere (see my first post on this thread) but incredibly warm temperatures. Some may argue that this is the mark of climate change. The snow drought this year has been caused by anomalous ridging (weather) and not necessarily climate, but you really can't help but think that global warming has at least tacked a few degrees onto the existing highs. Going forward, it seems that years like this may become more of the norm...
See here:
https://nwafiles.nwas.org/file/nwafiles/digest/papers/1977/Vol02No4/1977v002no04-Wagner.pdf
January 1977 was possibly the coldest month experienced in the eastern half of the country in the past 200 years. You had departures as low as -19 F for the month in central Appalachia. So is it any surprise the West lacked snow?
If something like the above occurred today, it would be blamed on climate change. Absolute high-end extremes at or above anything in recent decades have occurred when the globe was cooler. So how does that work really? If the same sensible wx (extremes and everything else) occur in cooler mean temps and lower CO2, and higher mean temps and higher CO2, well, see the issue here? Wild extremes and anomalies happen regardless of global temps or CO2 levels. Yes, there some variance, but there are numerous other natural external and internal factors impacting climate system over time that result in variance, and this can drown out defined signals solely based on CO2 levels, such as solar activity (e.g. Maunder Minimums) an Milankovitch cycles (changes in the Earth's eccentricity, obliquity, and precession). Items such as these dominiate, not CO2 levels. Don't get me wrong, CO2 level are a factors, but just b/c something is a factor, does not mean it is significant (statisically or otherwise), doom going to happen, or counterintutitive sensible wx impacts can not occur.