gdlewen
EF4
TL;DR. No tornado (yet again). Hopelessly-flawed chase that ended with an interesting encounter with a HP supercell.
Initially, June 17 was not to be a chase day, despite a MDT risk in central KS and very bullish NAM 12Z parameters in S KS (e.g. vicinity of Sedan.) However, most, if not all, CAMS snubbed SE KS, favoring convection further west. It was hard to resist, though, so I made a late decision to drive north.
Along the way an isolated cell formed SW of Wichita. There was also convection associated with a slow-moving cold front in W KS. Anticipating a northeasterly component to storm motion, the plan was to position somewhere north of Winfield, KS. (Far better would have been to approach Winfield from the south.)
While en route to Winfield, the storm SW of Wichita went supercellular and produced a tornado near Harper, KS at 2141Z. We stopped a few miles N of Winfield about 5:40PM to assess the state of things. (At this point we should have dropped S to Winfield and then W to Wellington.)
By 6:00PM, the "Harper Supercell" was over Wellington but was looking less and less like a classic supercell, so I decided there was no sense of urgency. We dropped slowly south while keeping the storm in sight, but never really got into a good position.
What I did not recognize was that this storm was in the process of transitioning to a HP mode....
By 6:30 PM it was clear that :
Up until 6:30 this storm seemed not so very imposing. Lightning was no longer frequent outside the rain-obscured center of the mesocyclone, which I'll refer to as the "visual mesocyclone" from here on. The front flank precipitation core was descending slowly from the north, driving us slowly southward, but that was the direction we wanted to go anyways.
But it actually was imposing.
One of my goals in chasing is to correlate what I see from the ground with what the data is showing, but in this case I totally missed it.
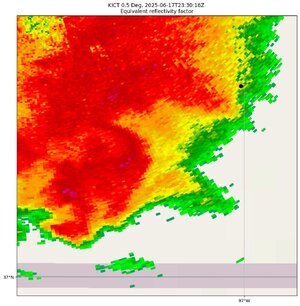
In an effort to understand happened--how I failed to connect things--I used a video image capture where lightning illuminated the rain-obscured part of the mesocyclone. This permits a rudimentary photogrammetric analysis to estimate the size and location of whatever visible feature can be associated with the circulation (not the actual mesocyclone, of course). In this case, it is the region of the rain-filled mesocyclone that is uniformly illuminated by lightning that we are trying to measure, and we hope that is a reasonable proxy for the actual mesocyclone.
Caveat: this is a minimum estimate of any size because:
The minimum radius is about 6km—since this is an estimate based on a visible feature of the circulation, the mesocyclone itself is undoubtedly larger.
This analysis all seems plausible, but if a StormTrack member can see an error, I would appreciate hearing about it. (The only thing worse than being wrong is never getting the chance to be right.)
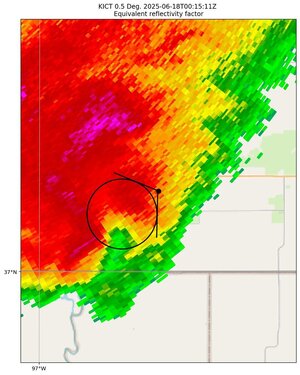
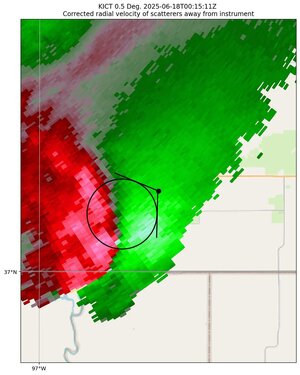
One more check on the plausibility of the analysis: a cross-section of the radar through the inflow region:
The visual record and data appear to be consistent, barring any serious errors. (I'm comfortable with it.)
ANYWAY: Despite being "out of position", we still have good visibility into the inflow region of the developing HP supercell. I would still prefer to be looking NW into it...
This may all be fun and games now, but at the time I was dismayed by what can only be described as the chaser version of "chess blindness". I figured we could only beat the storm to Arkansas City if we left immediately and made zero stops along the way. (This was a shame, because if we had moved south sooner we would have had a better view.)
It was close, but we got to US-166 and skedaddled east and got out of there just as the hail and heavy rain arrived. We got hit by a few large hailstones but only suffered minor dents, and then we were in the clear. What followed was a game of leapfrog along US-166 with multiple stops where we could get a good view of the storm—the further east you go the more hilly the terrain gets, but there plenty of good spots to stop along the way.
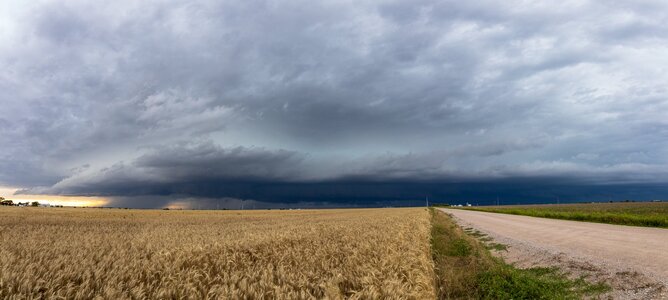
Near Dexter, KS, we got a chance to take a panorama with sufficient visual landmarks to analyze the visual mesocyclone:
Once again, the forward flank rain curtain is partially obscuring the northern edge of the visual mesocyclone, which makes estimation of that edge uncertain. US-166 breaks north here, making an S-curve before heading east again, so we are actually facing W in this panorama.
For the estimate of the mesocyclone dimensions we used the circular arcus-like cloud feature which spanned the visible circumference, therefore (again) limiting the analysis to a visible feature of the actual circulation.
We are very close to the leading edge of the visual mesocyclone at this point: about 1km, which is consistent with the 0000Z Dexter METAR cloud base report and the angle subtended by the ground-cloud base height in the picture. The estimated radius is ~ 4.5km and the meso is about to cross US-166, after which the HP supercell will be S of us (again).
This is too close, and we did not stay long at this position.
We made a few more stops, but the general configuration of the storm did not change much. When we got to Cedar Vale, it became clear that the storm could beat us to US-75 in Bartlesville, OK if we weren't careful, so gave up the chase. We did beat the storm to Bartlesville by about 5 minutes, which is good because US-75 was flooded by heavy rains as the storm passed through.
SUMMARY: It was kind of fun in the end, and I learned a few things on this trip. First: not to be complacent (crisis is the cure for complacence).
But also I have been trying to keep costs down by using only Basic RadarScope on an iPhone. This causes an odd "Perceptual Claustrophobia" that makes it hard for me to assess what's going on with a storm, especially when I try to show both reflectivity and storm-relative velocity panes at the same time. Others may be successful with only an iPhone but it's hard for me, so I think it's time to move up to GRLevel 2 or 3 on an iPad/tablet/PC.
Credits: Py-Art was used for radar analysis, MetPy for chase prep (not posted for the sake of brevity), Hugin for panorama preparation and Gimp for image analysis.
Initially, June 17 was not to be a chase day, despite a MDT risk in central KS and very bullish NAM 12Z parameters in S KS (e.g. vicinity of Sedan.) However, most, if not all, CAMS snubbed SE KS, favoring convection further west. It was hard to resist, though, so I made a late decision to drive north.
Along the way an isolated cell formed SW of Wichita. There was also convection associated with a slow-moving cold front in W KS. Anticipating a northeasterly component to storm motion, the plan was to position somewhere north of Winfield, KS. (Far better would have been to approach Winfield from the south.)
While en route to Winfield, the storm SW of Wichita went supercellular and produced a tornado near Harper, KS at 2141Z. We stopped a few miles N of Winfield about 5:40PM to assess the state of things. (At this point we should have dropped S to Winfield and then W to Wellington.)
By 6:00PM, the "Harper Supercell" was over Wellington but was looking less and less like a classic supercell, so I decided there was no sense of urgency. We dropped slowly south while keeping the storm in sight, but never really got into a good position.
What I did not recognize was that this storm was in the process of transitioning to a HP mode....
By 6:30 PM it was clear that :
- we were facing a maturing HP supercell, and
- it was almost certain to cut off our access to US-166 in Arkansas City, which was the best route to stay ahead of it as we headed home.
Up until 6:30 this storm seemed not so very imposing. Lightning was no longer frequent outside the rain-obscured center of the mesocyclone, which I'll refer to as the "visual mesocyclone" from here on. The front flank precipitation core was descending slowly from the north, driving us slowly southward, but that was the direction we wanted to go anyways.
But it actually was imposing.
One of my goals in chasing is to correlate what I see from the ground with what the data is showing, but in this case I totally missed it.
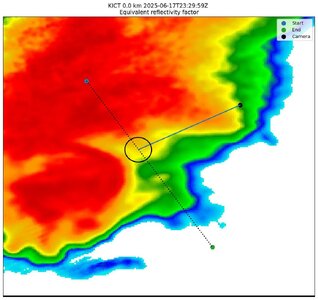
In an effort to understand happened--how I failed to connect things--I used a video image capture where lightning illuminated the rain-obscured part of the mesocyclone. This permits a rudimentary photogrammetric analysis to estimate the size and location of whatever visible feature can be associated with the circulation (not the actual mesocyclone, of course). In this case, it is the region of the rain-filled mesocyclone that is uniformly illuminated by lightning that we are trying to measure, and we hope that is a reasonable proxy for the actual mesocyclone.
Caveat: this is a minimum estimate of any size because:
- front flank precipitation partially obscures the northernmost edge, so this analysis is only as good as our estimate of that northern tangent ray, and
- the entire base of the cell was rotating so we are restricting the numerical analysis to the portion of the actual mesocyclone for which I feel we can make sensible measurements (the proxy)
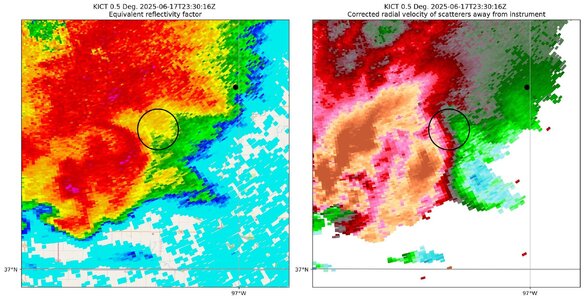 |
Estimate of Size and Position of the "Visual Mesocyclone", Based on Measurements of the Video Image. Our location is marked by the black dot. |
The minimum radius is about 6km—since this is an estimate based on a visible feature of the circulation, the mesocyclone itself is undoubtedly larger.
This analysis all seems plausible, but if a StormTrack member can see an error, I would appreciate hearing about it. (The only thing worse than being wrong is never getting the chance to be right.)
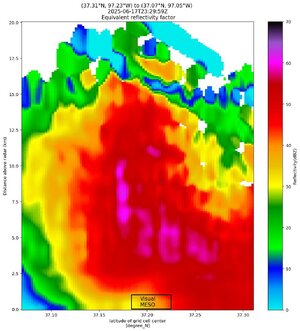
One more check on the plausibility of the analysis: a cross-section of the radar through the inflow region:
The visual record and data appear to be consistent, barring any serious errors. (I'm comfortable with it.)
ANYWAY: Despite being "out of position", we still have good visibility into the inflow region of the developing HP supercell. I would still prefer to be looking NW into it...
This may all be fun and games now, but at the time I was dismayed by what can only be described as the chaser version of "chess blindness". I figured we could only beat the storm to Arkansas City if we left immediately and made zero stops along the way. (This was a shame, because if we had moved south sooner we would have had a better view.)
It was close, but we got to US-166 and skedaddled east and got out of there just as the hail and heavy rain arrived. We got hit by a few large hailstones but only suffered minor dents, and then we were in the clear. What followed was a game of leapfrog along US-166 with multiple stops where we could get a good view of the storm—the further east you go the more hilly the terrain gets, but there plenty of good spots to stop along the way.
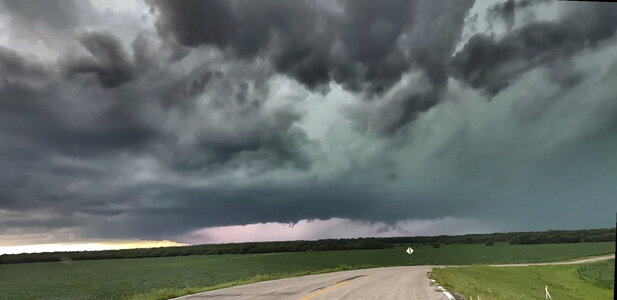
Near Dexter, KS, we got a chance to take a panorama with sufficient visual landmarks to analyze the visual mesocyclone:
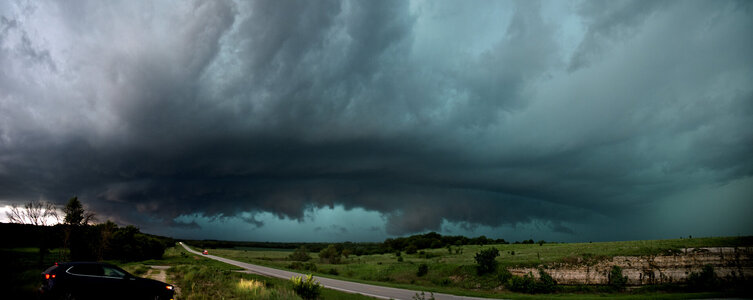 |
| Panorama of Approaching HP Supercell taken with Nikon Z6, and stitched with Hugin. The panorama has a HFOV of 154˚. Looking W from US-166 near Dexter, KS. |
Once again, the forward flank rain curtain is partially obscuring the northern edge of the visual mesocyclone, which makes estimation of that edge uncertain. US-166 breaks north here, making an S-curve before heading east again, so we are actually facing W in this panorama.
For the estimate of the mesocyclone dimensions we used the circular arcus-like cloud feature which spanned the visible circumference, therefore (again) limiting the analysis to a visible feature of the actual circulation.
We are very close to the leading edge of the visual mesocyclone at this point: about 1km, which is consistent with the 0000Z Dexter METAR cloud base report and the angle subtended by the ground-cloud base height in the picture. The estimated radius is ~ 4.5km and the meso is about to cross US-166, after which the HP supercell will be S of us (again).
This is too close, and we did not stay long at this position.
We made a few more stops, but the general configuration of the storm did not change much. When we got to Cedar Vale, it became clear that the storm could beat us to US-75 in Bartlesville, OK if we weren't careful, so gave up the chase. We did beat the storm to Bartlesville by about 5 minutes, which is good because US-75 was flooded by heavy rains as the storm passed through.
SUMMARY: It was kind of fun in the end, and I learned a few things on this trip. First: not to be complacent (crisis is the cure for complacence).
But also I have been trying to keep costs down by using only Basic RadarScope on an iPhone. This causes an odd "Perceptual Claustrophobia" that makes it hard for me to assess what's going on with a storm, especially when I try to show both reflectivity and storm-relative velocity panes at the same time. Others may be successful with only an iPhone but it's hard for me, so I think it's time to move up to GRLevel 2 or 3 on an iPad/tablet/PC.
Credits: Py-Art was used for radar analysis, MetPy for chase prep (not posted for the sake of brevity), Hugin for panorama preparation and Gimp for image analysis.
Last edited:

