• While Stormtrack has discontinued its hosting of SpotterNetwork support on the forums, keep in mind that support for SpotterNetwork issues is available by emailing [email protected].

2012-05-30 FCST: KS/OK

Joined
Mar 16, 2012
Messages
32
Location
Lenexa, KS
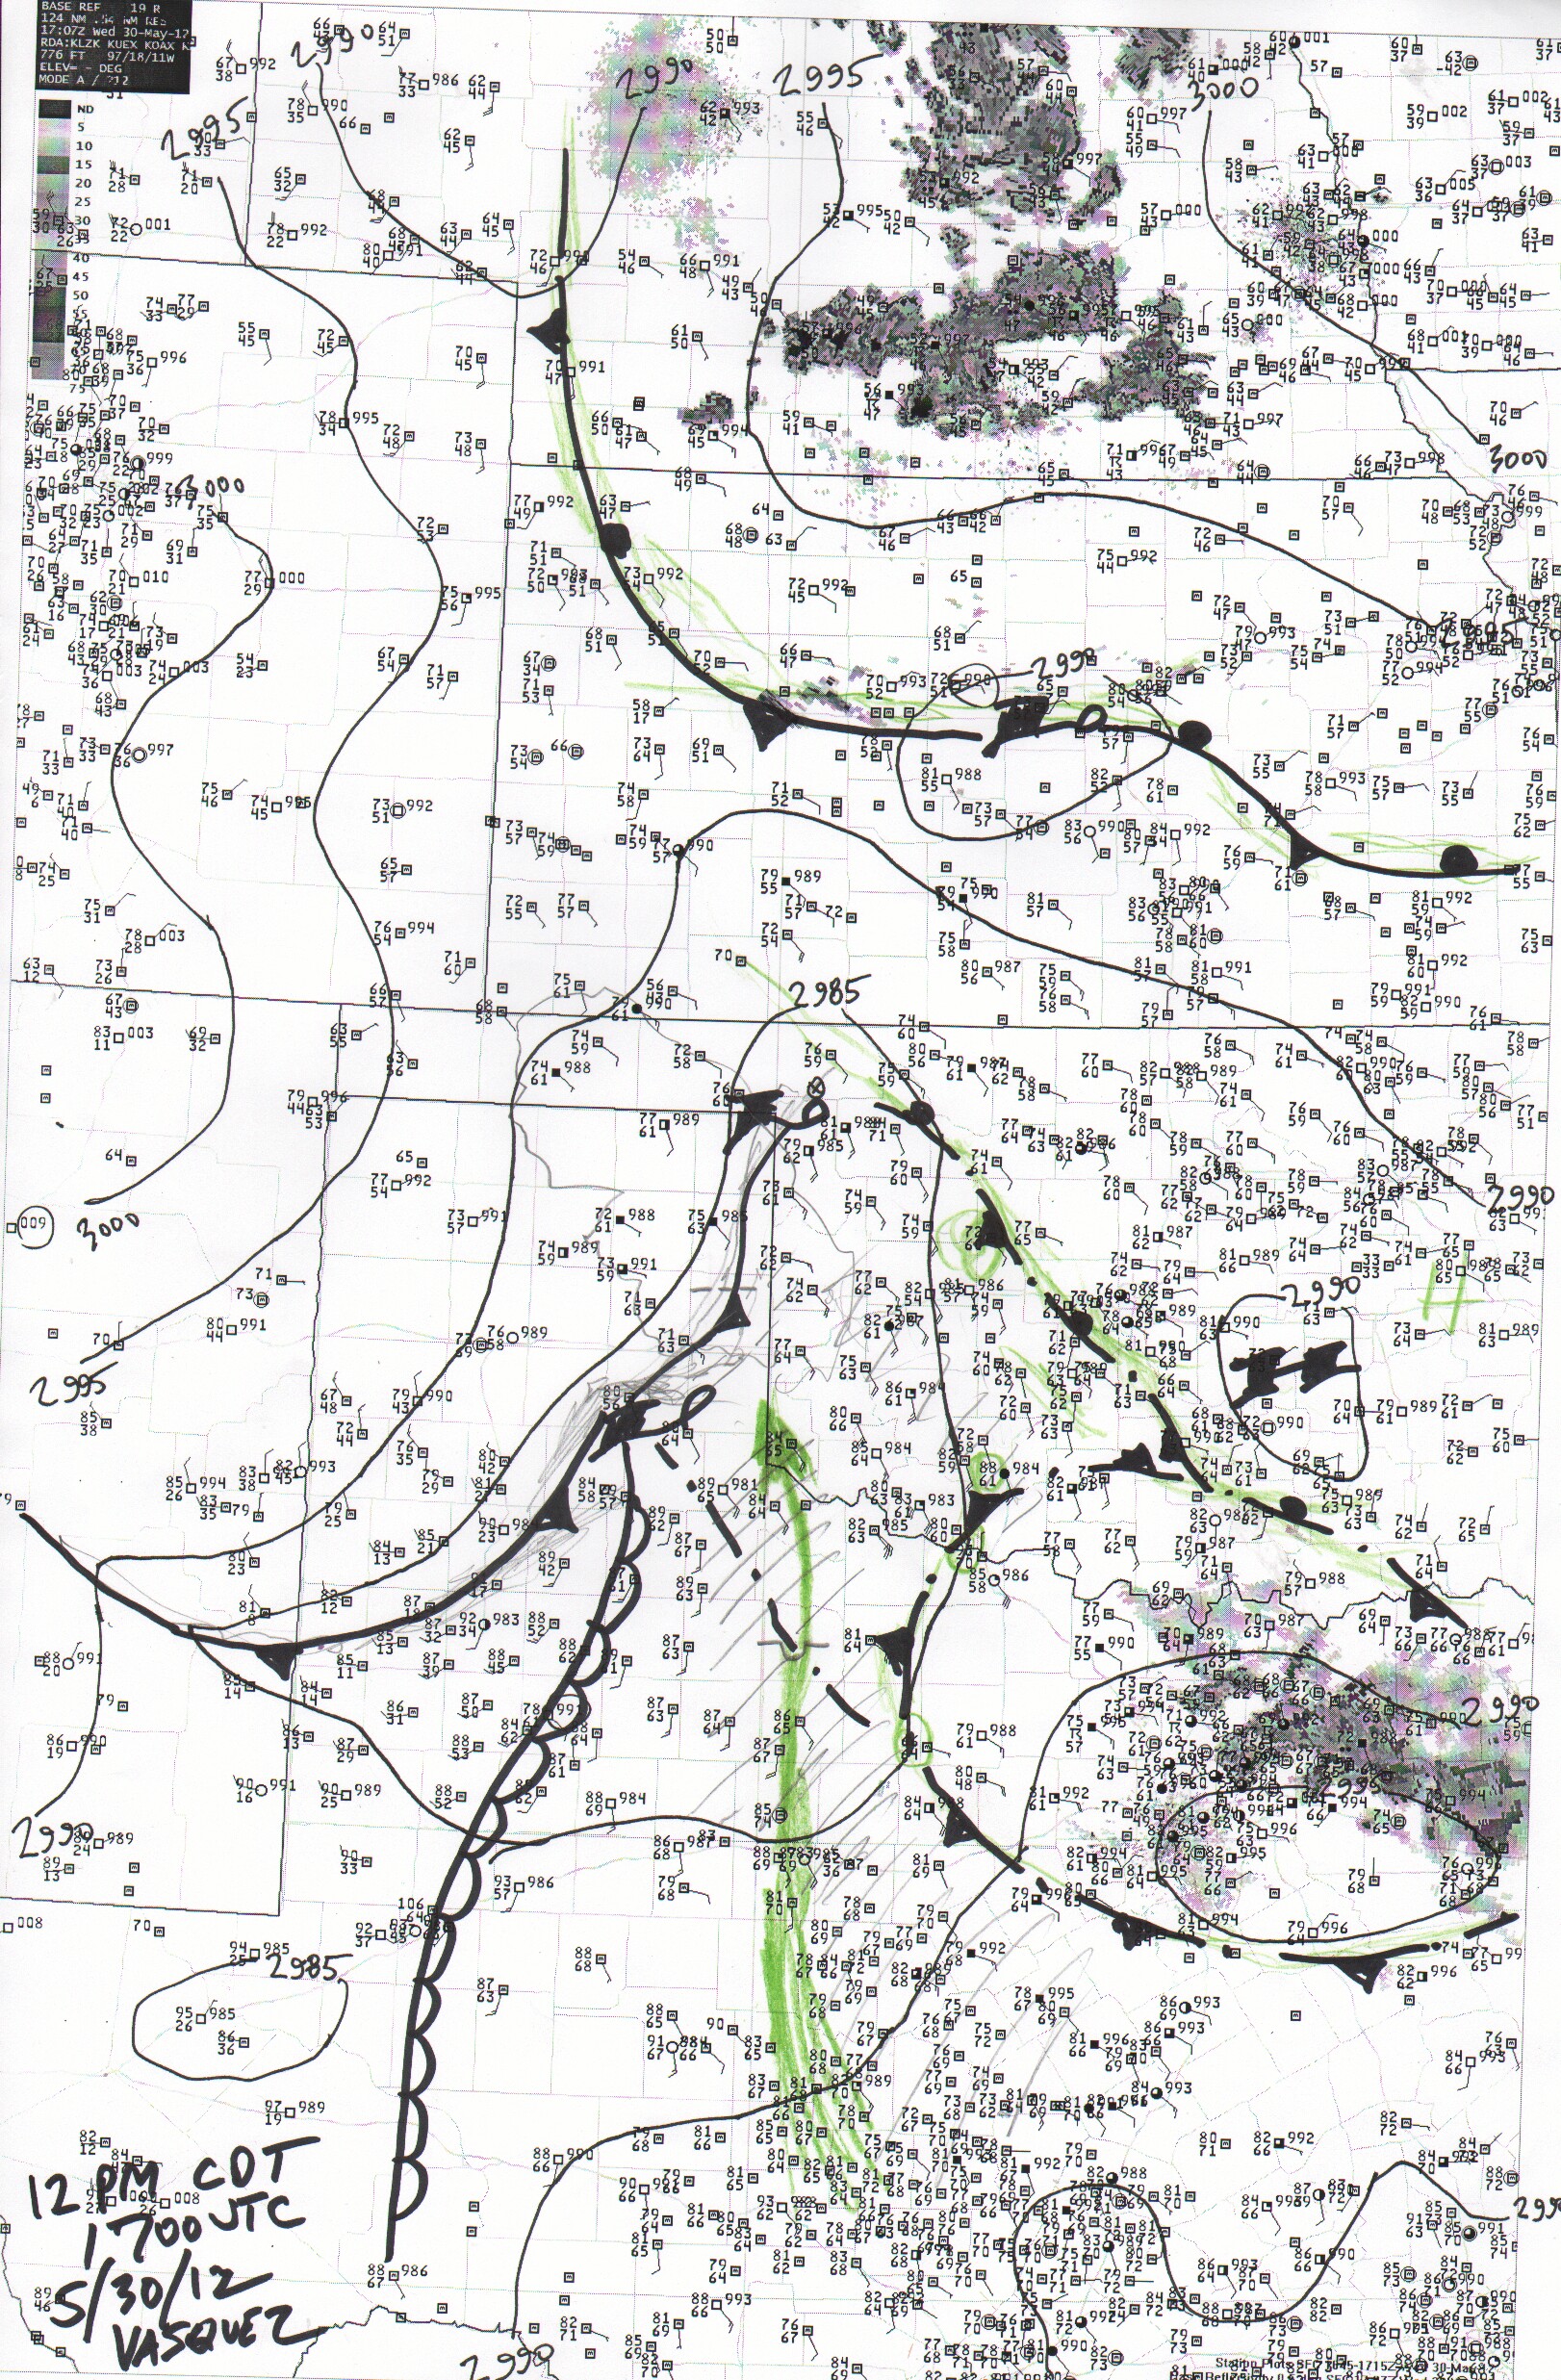
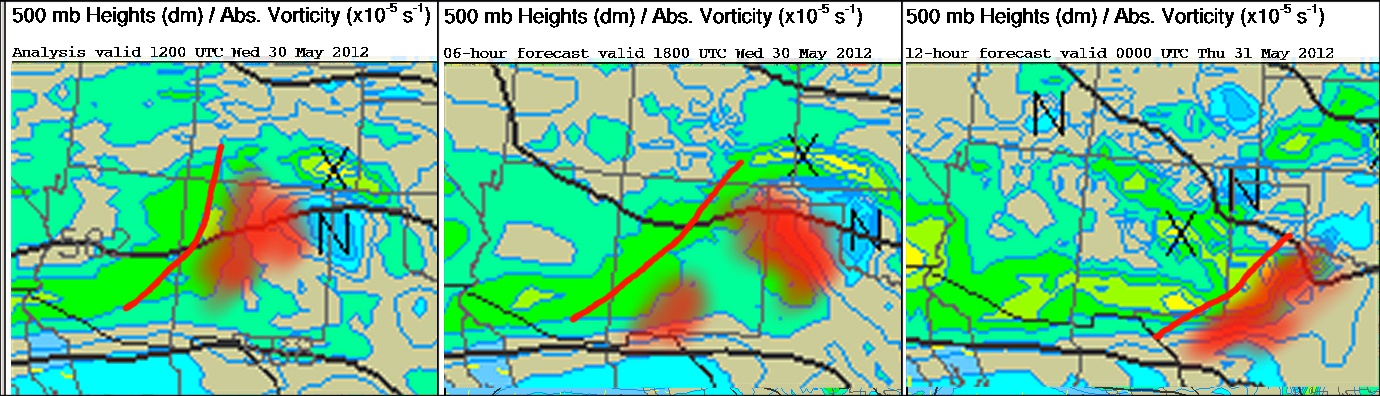
A bit of a tough setup across Oklahoma and Kansas. Both NAM and GFS are reflecting the split flow regime that SPC is noting. The models are in agreement with advecting 70+ dewpoints into central Oklahoma by 30/18Z and CAPE AOA 4000 Jkg with low CIN. Storms should be firing across Kansas as a cold front sags south during the day and a surface low is stationary north of Amarillo with an inverted trough forecast to move through the OK panhandle and into the DDC area.

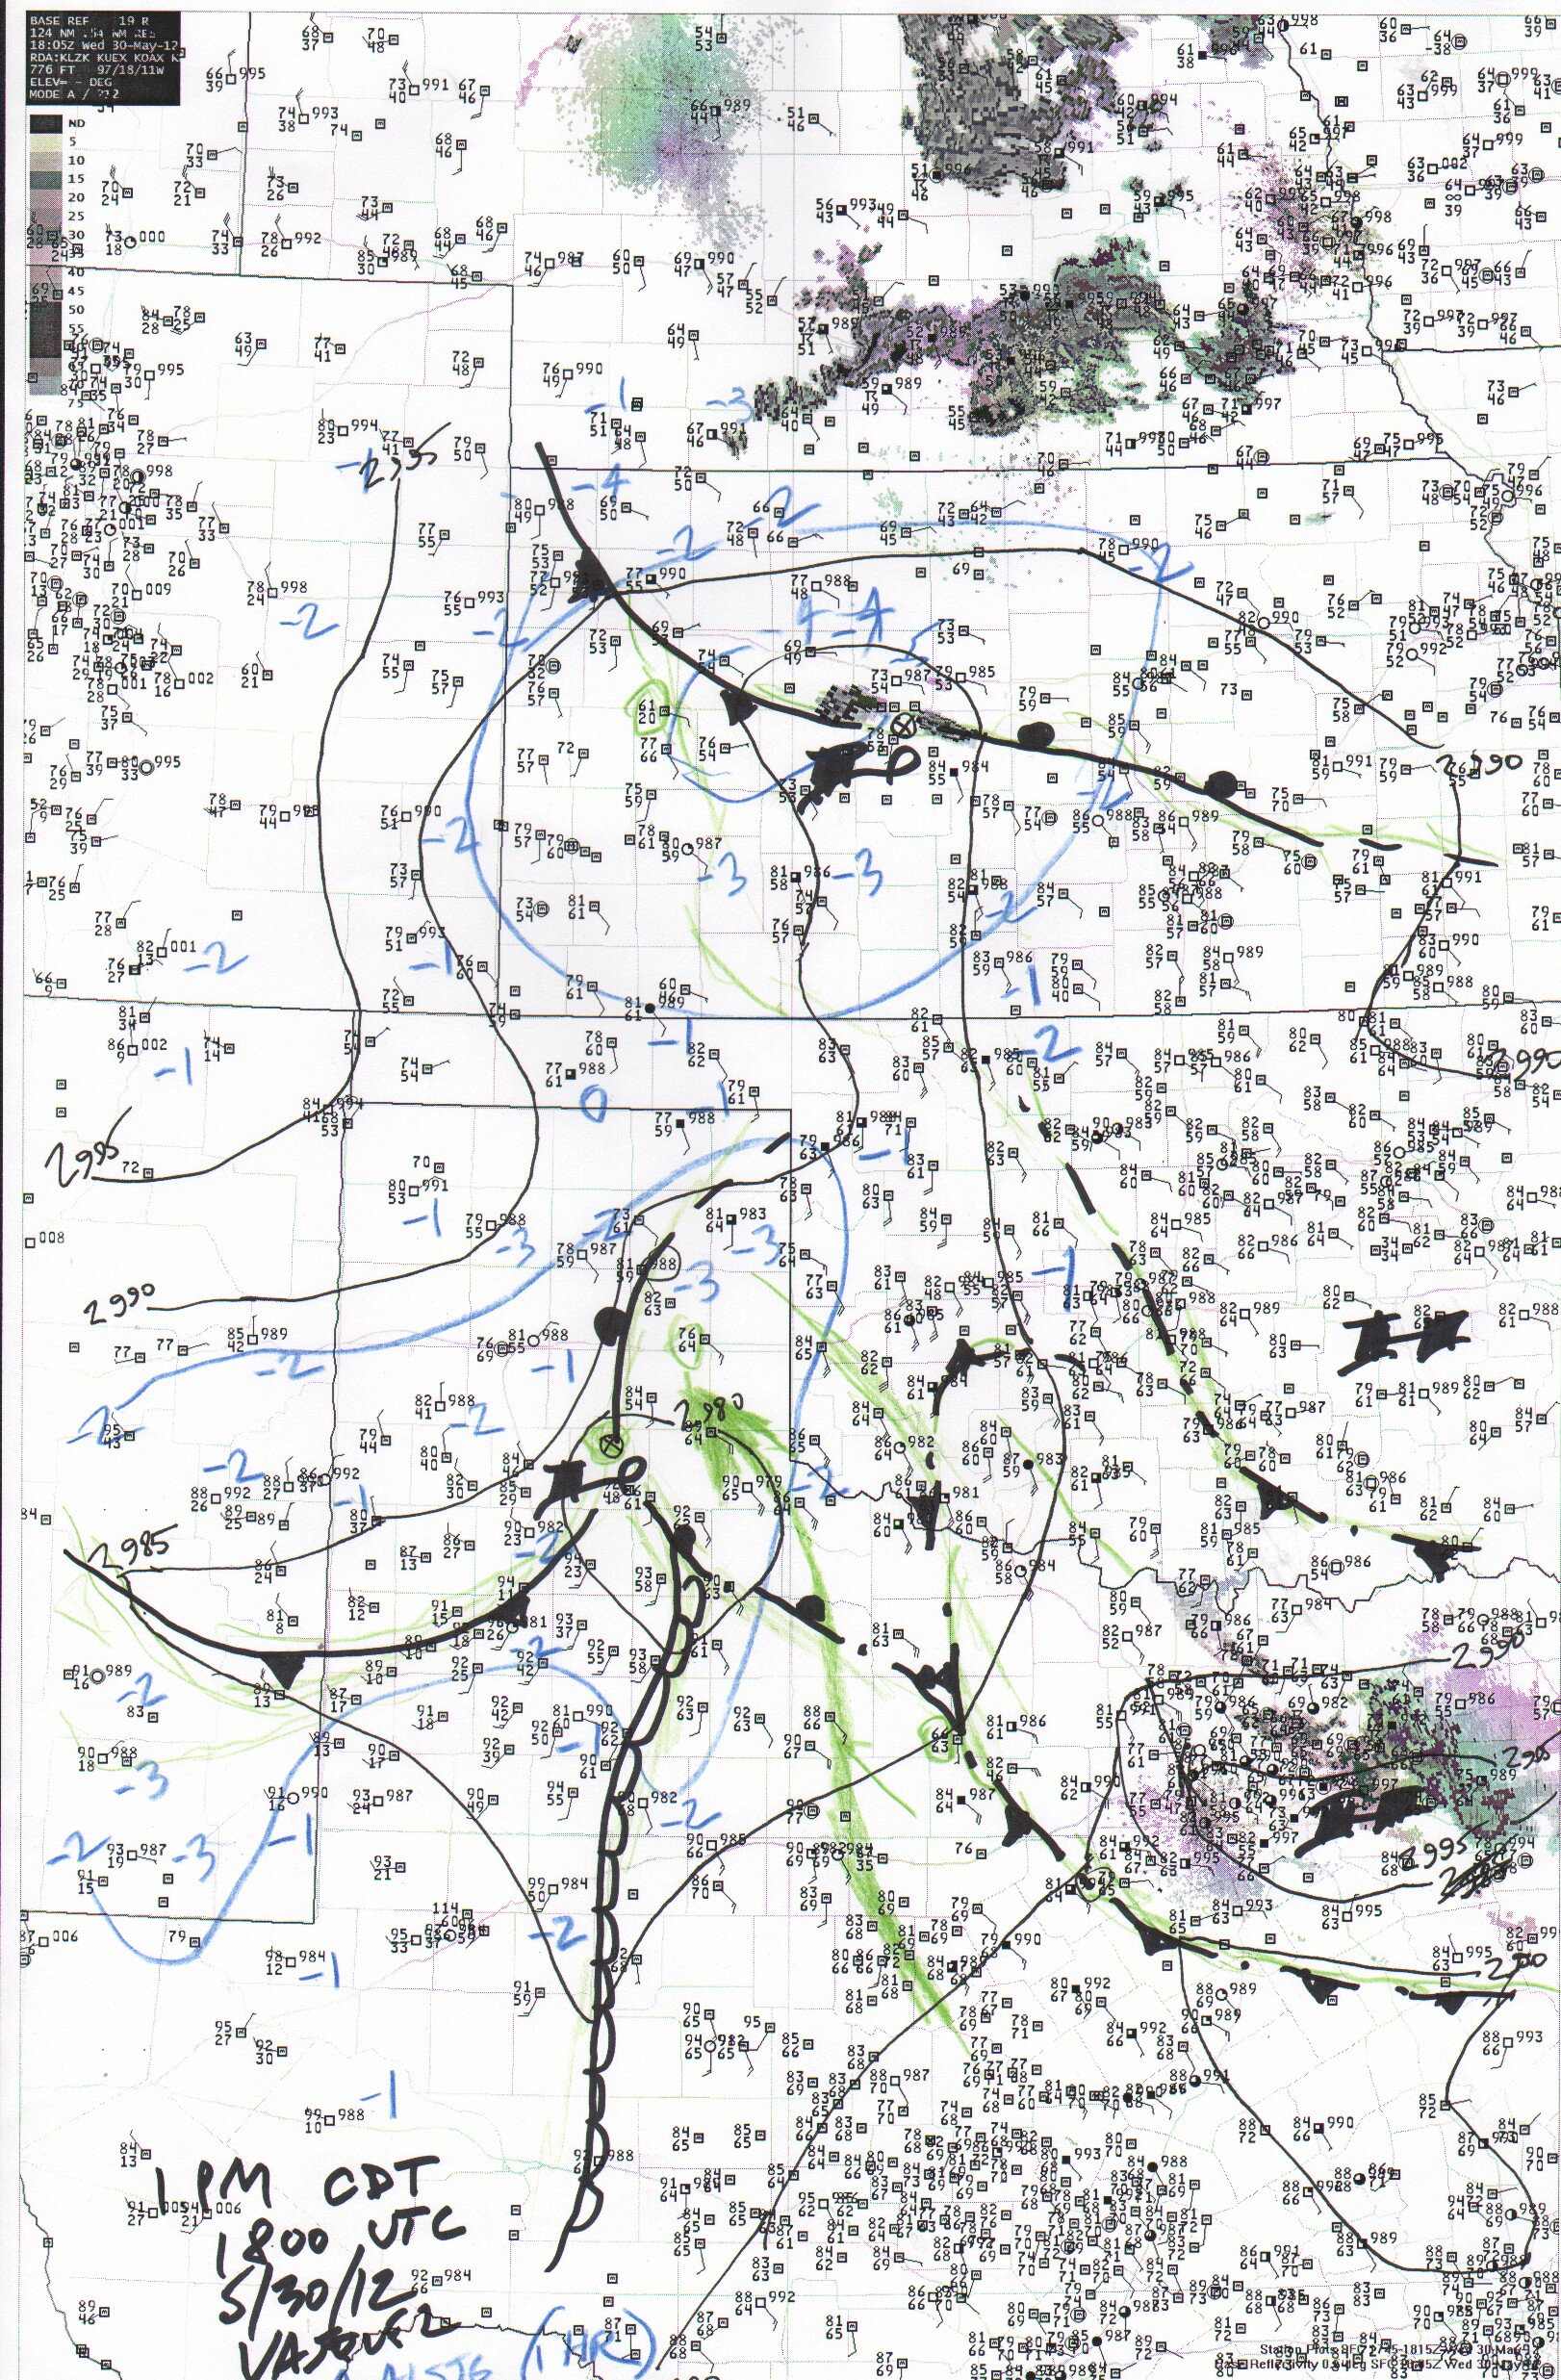
As the cold front sags to the SW from Kansas into Oklahoma, convection should increase invof the front. Model progs have been consistently showing an almost stationary dry line in place across NW Texas and W Oklahoma.

There's only 10-15 knot 0-1 km shear, but with the impressive CAPE, improving lapse rates into the evening, strong upper level flow, and SRH of 250+, and veered winds, there's a good chance of tornadoes, but they may quickly become rain-wrapped.
 
with storms growing upscale pretty quickly I would focus my attention on any "pre-complex" cells blowing up on the weak stalled E-W front or other old outflow boundaries. In of extreme southern kansas and northern/northwestern oklahoma. Before the large MCS moving in from the NW overtakes them. those cells may be able to realize the strong instability and possibly feed on any vertical vorticy along the boundaries
 
Last edited by a moderator:
Best hodographs for 18z time frame appear to be in the western OK and E/TX area near I-40. Not at all impressed with areas north per RAP forecast. LCL's should be acceptable. Wild card is surface low. Target for today will be Shamrock, TX.

W.
 
Last edited by a moderator:
No time to comment but I wanted to add in this surface analysis of about 15 minutes ago (am forecasting for a client). Boundary positions are the key to what's going to be happening today... and we've got them in spades. This is the best I can make out... and I'm still needing more radar and satellite.

Click to enlarge.


I have been wanting to add more of these maps to the FCST threads but am gradually figuring out how to fit them into my workflow.
 
The 12Z RAP and especially the 12Z NAM showed very little inhibition over E TX panhandle and W OK by 00Z. But each run of the RAP (through 17Z) has been increasing the capping forecast at 00Z, especially along the central/southern TX/OK border. Is this believable and/or something to worry about?
 
New surface analysis:


Couple of key points:

* Strong northwestward advection showing on FDR and DYX radars (esp DYX). Looks like this is bringing moisture right up US 287 and we may see initiation west of Childress. This appears to be in response to a short wave indicated on the NAM over the Albuquerque area which will move into the LBB area this afternoon (see 500 mb vorticity products).

* The hodograph is fairly straight line, so being "northeast of the low", i.e. near Childress, is key. Otherwise splitting modes will be the rule. Also due to WNW flow aloft and SE flow at the surface in the target, it is interesting that the right motion vector is close to stationary or maybe even slow south or southwest... though cells will have a "northwest flow" structure.

* I do not understand the SPC positioning on the Day 1, esp the tornado 10%. I may be proven wrong but right now I'm just not seeing forcing for initiation in the OK-KS border area. I'm suspecting contamination in the models from all the outflow has probably placed model-forecast features in weird areas and this is biasing the outlooks. The air up there looks a little worked-over on satellite... rather flat stratus-y type cloud. EDIT: I see gravity waves working the low cloud fields in the Garden City area, so something may squeak out of there yet... I just don't know where the SRH is going to come from up there unless the surface patterns pull together.
 
Last edited by a moderator:
The 12Z RAP and especially the 12Z NAM showed very little inhibition over E TX panhandle and W OK by 00Z. But each run of the RAP (through 17Z) has been increasing the capping forecast at 00Z, especially along the central/southern TX/OK border. Is this believable and/or something to worry about?

I would avoid looking at CINH/capping output images since there's too many influences, and look more at the raw ingredients, like low-level parcels (richness and depth) superimposed on a modified forecast sounding (and not one from the models, but adjusted using their input). The most I'd go into as far as capping changes is model forecast of 700 mb temperature. The changes I'm seeing over Panhandles region suggests neutral to slight cap removal, and I saw evidence on the NAM of a weak short wave trough approaching the LBB-AMA-CDS area. As far as the rest of the thermodynamics, the NOAA/RR had about 100 mb of 14 g/kg air (i.e. low-mid 60s dewpoints) over the Lawton area this afternoon, which was consistent with what I saw on the DRT sounding and with the low cloud plume extending north to the target (OUN and FWD were convectively contaminated, so no help there). I think we'll initiate fine... lots of boundaries to work with, and decent moisture.
 
Here is the NAM output indicating that short wave trough I mentioned earlier. Click to enlarge. Short wave trough indicated by red line, and 500 mb positive vorticity advection by red shading. Normally I don't see a short wave this clear cut, and it had consistency from 00 to 06 to 12 hr, so I wanted to share it. The caveat is that vorticity diagnostics are sort of an "old school" method, and there are assumptions about thermal advection and vorticity increasing with height in order for the vertical velocity equation to yield upward motion, but generally this method works along with all your other tools. Also it's important to keep in mind that this doesn't actually "trigger" storms but assists with cap removal as it reaches the moist sector.


20120530_sat_s.jpg
 
Last edited by a moderator:
Great forecasting Tim. Thanks for the info (I have a lot to learn about reading models). Looks like capping was not an issue, and that the cells in the E Panhandle really are splitting, as predicted.
 
Earlier today I was quite worried the morning convection would prevent issues across much of the MDT risk as far as moisture return was concerned and looking at current dewpoints it appears my fears may have been realized. Even with the addition of a strong LLJ later this evening I see much weaker instability compared to yesterday's setup in much of Oklahoma (considering dewpts in North TX right now are in the mid-upper 50s).
 
Nice rotation on storm headed toward Mason, TX which is identified in both San Angelo and Central Texas radar. Looks like a few guys didn't bite off on the OK mod risk. BWER in the lowest scans as well. Just had time to start watching but appears to be going through a cycle at this time.
 
For whatever reason, torn warn for storm by San Angelo expired but is back up and the storm is looking strong again. I also need to correct that for those on Chasertv, no one is on this storm. I would be interested to see any reports from someone on here tomorrow.

Quickly looked at the models this morning and it would appear Tim was right on with the Childress area. I don't recall a CAPE, helicity region around Abilene but apparently that is what spawned the one long track storm going toward San Angelo area on the dryline. This was in the LLJ region Tim pointed out and along the track of the shortwave. I don't remember the CIN, but perhaps that was enough trigger to get this one storm rolling.

I would imagine that not only would it be nice to be away from the chaser convergence, but being off the dryling I bet this storm has/had good structure too. Wish I was there.
 
Last edited by a moderator:
Back
Top