Smoothing of radar data

Joined
Dec 4, 2003
Messages
3,411
I noticed that in the "best radar images" thread we have going that nearly all of them use the smoothed radar displays. Being from the old school I've always been skeptical of using smoothed algorithms, since anti-aliasing algorithms are always a mathematical approximation of actual data.

I decided to put the one in GrLevelX to the test, one-dimensionally, with a radial from this scan from 5/3/99:
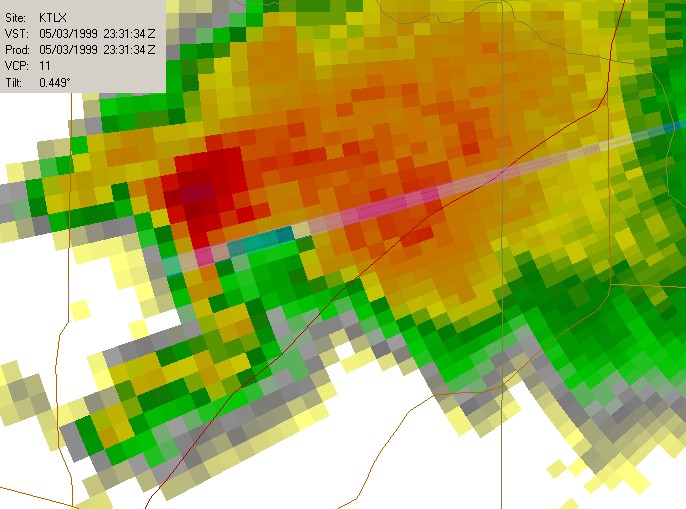
dbzsmooth1.jpg


I used a special palette for the smoothed data that allowed me to quickly extract the indicated values.
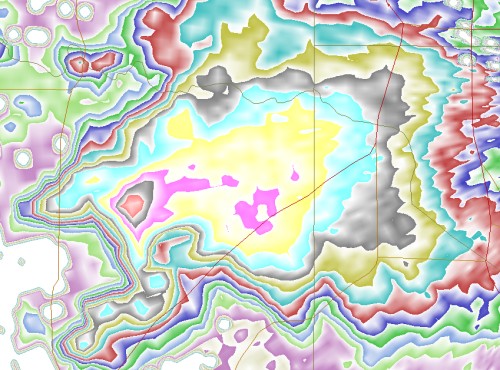
dbzsmooth2.jpg


Graphed out, here's how they correlate.
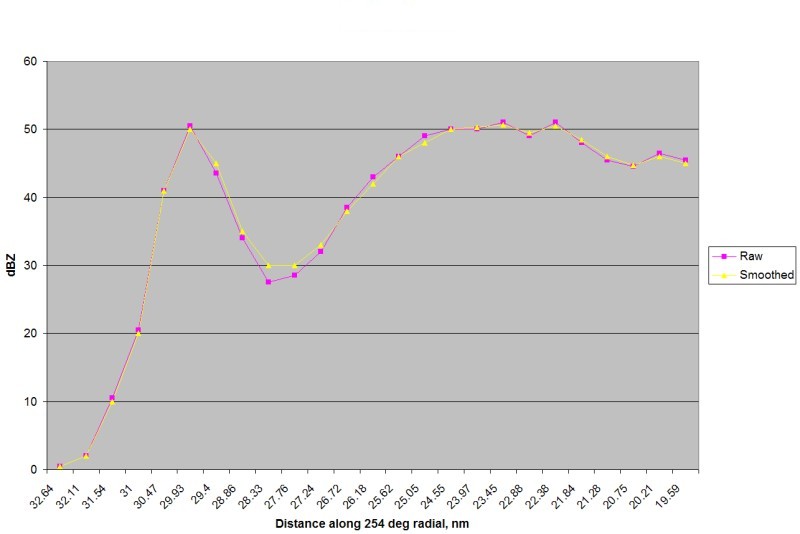
dbzsmooth3.jpg


Actually that's remarkably close to the actual data. I am not sure exactly what algorithm GrLevelX is using, possibly a built-in anti-aliasing function from the DirectX package, but it appears that the loss of actual data is negligible. The loss of correlation at 27 nm above is due to a sharp gradient orthogonal to the radial so I don't think it's significant.

I realize we have a pro-smoothing crowd here but I thought I'd stir up some discussion on this topic.

My stomach still sours when I see smoothing of velocity data, as point readouts of velocities can be critical, and those get lost in smoothing. You can't see gate-to-gate shear when you can't see the gates.

Tim
 
My stomach still sours when I see smoothing of velocity data, as point readouts of velocities can be critical, and those get lost in smoothing. You can't see gate-to-gate shear when you can't see the gates.

Tim

I agree about the smoothing of velocity, a set of products that I think lose a lot of detail when smoothed. It is worth noting that GRLevelX really is does more of an interpolation than a smoothing. I can take radar data into Matlab and do a 1-pass Barnes analysis to end up with a more realistic-looking reflectivity image than the raw (i.e. binned) reflectivity data. As noted, GRx does more of an "interpolation", taking relatively low-resolution data and analyzing it to a much higher-resolution grid to display. Mike, the developer of the GRx apps, is a member and can explain better. I've seen many examples of such interpolation/"smoothing" actually making some storm features more obvious and easier to pick out (typically easier to pick out WERs/BWERs, sometimes hook echoes are much more obvious, etc). I look at radar data quite a bit for my grad studies/research, I was very skeptical when I first bought GR3. Alas, I've found that I spend more time with "smoothing"/interpolation on than off.

I've also noticed, however, that the smoothing/interpolation is less beneficial with the new super-res Level-2 data. For the Level-3 data, however, I'm still a smoothing/interp user.

I made the following elsewhere earlier this year, but I'll include it here since it applies still:
My preference applies only to GRx smoothing (and I prefer GR3 over GR2AE smoothing)... I've seen other "smoothed" radar imagery that looks like a very bad cartoon (ThreatNet, several of the TV radar systems, etc). Just some "thinking aloud" re: the issue of reflectivity gradients being smoothed. Suppose we have the following data:
Code:
0 1 2 3 4 5 6 7 6 5 4 3 2 1 0
Say that the system we use (or the resolution we use) requires that the data get binned -- 5 points are averaged to create a bin. In this system, the data would look something like like this:

Code:
||         2        ||          5.8            ||           2            ||
If we set the above on a 1D grid, it may be comparable to looking at three adjacent radar bins or gates (I'll ignore center-weighted averaging for simplicity). The system may be viewed like the following:
Code:
||  2   2   2  2   2 || 5.8 5.8 5.8  5.8  5.8 || 2     2     2     2    2 ||

x=1   2   3   4   5     6    7    8    9    10     11   12   13   14   15
In other words, each point within a bin is given the same value as the average of that bin. If we look at non-smoothed (or non-interpolated) radar data, this may be analogous to looking at three consecutive radar bins. Given the above, it would appear that there is a gradient between X=5 and X=6, and another gradient at X=10 and X=11. The above could be similar to the 88d processing (or any system that spatially averages data). Now, let's use some ideal interpolation scheme to interpolate values at gridpoints (back to a "high resolution" system):
Code:
|| 0 1 2 3 4 || 5 6 7 6 5 || 4 3 2 1 0 ||
To little surprise, we see that there may not be any "real" significant gradients present. In the "low-resolution" system, the two high gradients were the result of averaging. Since averaging reduces the resolution of the data, why would one choose the averaged set when wanting to find the "true" solution? Sure, it's unlikely that the interpolated solution will ever exactly match the "true" solution (with the degree of error affected by the specific scheme employed), but it may well better match the "truth" than does that "averaged" / low-resolution solution! The OBAN or interpolation method chosen tends to reconstruct the gradients that are present in the real atmosphere. Though this means that the strong gradients that actually exists in the "true" solution may get smeared out a bit, it also means that many of the weaker gradients in the "truth" are more accurately represented as such.
 
Last edited by a moderator:
From the non-scientific standpoint and being that I'm the only non-met posting in this thread so far, this might be a little naive but it appears to me that smoothing just uses the law of averages, right? So the actual information shouldn't be but a tiny bit on either side of the mean.
I'll stick with smoothing. It's like choosing Xbox over Atari for me.
 
You're also comparing apples and monkeys with Level III NIDS vs Level II Super-Res data...

Considering that the storm isn't composed of individual boxes all at the same dbZ, you gotta do something!
 
GR3 uses bilinear interpolation so the dbz at the center of a smoothed bin should be (almost) exactly the bin's value. I don't think there's any doubt that the smoothed display more closely matches what's out in the real world ... assuming that the radar isn't grossly undersampling the phenomena.

Superres L2 data is another matter! The bins have such a poor aspect ratio that even bilinear interpolation fails at reasonable ranges, ie. the bilinear kernel is exposed on the display. In addition, there appears to be more noise in the data due to fewer samples being used in a bin. I struggled with this for a while and looked at various techniques. I went as far as implementing the nexrad recombination algorithm in a pixel shader but the results came back as expected: a bloated/blobby/unnatural mess. In the end, I came up with what I believe is an acceptable solution in GR2Analyst. It performs a range-dependent weighted moving average based on the aspect ratio of the bins. All of this is done in the pixel shader while drawing.

About the gradients in Jeff's post. It's not the gradient that appears large between X=5 and X=6, it's the delta (aka. discrete) difference. The gradient in the averaged bins (delta / distance) is actually lower than in the higher res bins, as expected.

Edit: IMHO, Superres data looks terrible zoomed out, whether it's smoothed or not, because the data is noisy and badly undersampled on typical monitors. However, I may have stumbled upon a pretty good solution while experimenting with smoothing superres data.

Mike
 
Last edited by a moderator:
Back
Top