• A friendly and periodic reminder of the rules we use for fostering high SNR and quality conversation and interaction at Stormtrack: Forum rules

    P.S. - Nothing specific happened to prompt this message! No one is in trouble, there are no flame wars in effect, nor any inappropriate conversation ongoing. This is being posted sitewide as a casual refresher.

Midwest December severe weather (tornado) outbreak - 15 December 2021

Jeff Duda

site owner, PhD
Staff member
Site owner
Supporter
Joined
Oct 7, 2008
Messages
3,699
Location
Denver, CO
I am posting this here because I did not chase this event, and this discussion will be focused more on the aftermath and meteorology rather than on chase logistics.

While most of the weather community has been (understandably) focused on the damage surveys for the tornado outbreak from Friday, December 10th, there was also a significant and historic (read, record breaking) severe weather outbreak (including a ton of tornadoes) across the eastern Plains and upper Midwest on Wednesday, December 15th, which was also fairly well-forecast, and which was also associated with significant non-convective hazardous weather (mostly extreme surface wind gusts and wildfires).

Now that the damage surveys of this event are mostly in, it has dawned on me just how big of an event this was.

First, the total reports:
storm_reports_20211215.png
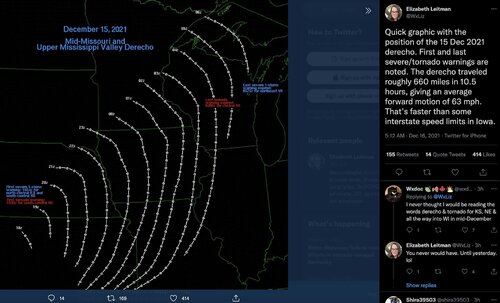
There were ~600 total reports of severe weather from C KS NEwd through C WI, with wind accounting for nearly 90% of the total reports. There were 61 significant wind reports, the peak of which was 93 mph (with a handful of other lower-90s measured gusts) near Lincoln, NE, and a few dozen of 80 or above scattered about. The wind aspect alone likely qualifies this event as a derecho.

And I don't know of a documented derecho in the month of December in the US.

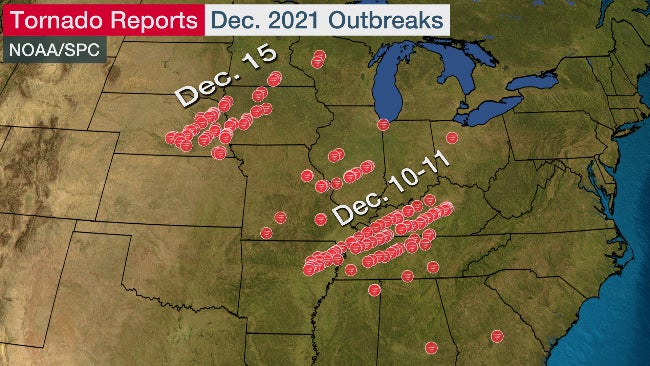
There were also 39 reports of tornadoes. Although, after I combed through the Twitter pages of the various NWS offices, I have found logs for at least 48 separate tornadoes, including (state-by-state):
  • NE: 15
  • IA: 22
  • MN: 7
  • WI: 4
There were a ton of significant tornadoes as well, even though the highest rated is only EF2:
  • EF2: 21
  • EF1: 17
  • EF0: 8
  • EFU: 3
Some of the offices have reported that they are not yet done looking for tornado paths and will be looking at high-res satellite imagery of ground scouring for evidence of additional tracks.

At least 4 of the tornadoes in Iowa had path lengths of more than 20 miles, and almost all of the Iowa tornado tracks were longer than 10 miles!

A few records were set regarding the tornadoes.
  • NWS Chanhassen has confirmed the first December tornado in the state of Minnesota. I haven't checked Wisconsin's records, but I wouldn't be surprised if the Wisconsin tornadoes were a record, too.
  • Harold Brooks at NSSL noted many records for most Tornado Warnings in these states for multi-month periods:
Watching the event unfold in real time, TDSs popped up on radar left and right. Here are some examples:
kdmx_20211215_2315_CC_0.5.png
kdmx_20211215_2330_SRV_0.5.png
koax_20211215_2236_SRV_0.5.png

I found it interesting how the tornadoes in IA seemed to be favored along the portion of the QLCS convection that was aligned more NW-SE rather than N-S, as most of the QLCS in Iowa was aligned. The 0-1 km shear and 0-2 km storm-relative flows were ideally aligned in both places, but I would have thought the orthogonality between the front of the line and the shear would have favored more tornadoes to the south and east of where the main corridor was (thinking Des Moines and points south towards the IA/MO border):

0-1-km shear
Screenshot 2021-12-18 at 14-50-26 Mesoscale Analysis Archive.png
0-2-km storm-relative winds
Screenshot 2021-12-18 at 14-50-10 Mesoscale Analysis Archive.png

Also amazing was how much real estate was under a warning at some point during the event:
all_warnings_20211215.jpg
Only Lyon and Osceola Counties in Iowa were not under a warning at some point during the day! That's like 97% of the area of the state!

The severe convective part of this event was nuts, and that was only one aspect to this event. Multiple states (some of the same areas that were also hit by severe weather, go figure) set all-December records for maximum temperature:
There was also some really nasty wind and wildfires behind the convective part of the event. Too much to go into here.

Maximum measured wind gusts during the 24-hour period ending local midnight on 16 December 2021
Note a handful of 100+ readings. There was also a 104-mph gust in New Mexico
Dec_2021_cyclone_plains_max_gusts.png

Just an amazing synoptic scale cyclone. One for the textbooks. Note the blowing dust and smoke plumes from the TX/OK PH and northward.
cyclone_geocolor_20211215_2051Z.png
 
Last edited:
SPC has stated that this event now holds the record for the most 75+ mph wind reports in one day since 2004 with 61 reports (beating out the August 10, 2020 derecho which previously held that record). It is also now ties the 5th largest tornado outbreak for Iowa with 22 confirmed tornado tracks (tying with May 8, 1988) and beating out July 19, 2018.

IMG_1105.JPG

The image above was posted on Twitter on the evening of December 15th, since then an additional 6 reports of 65+ knot higher winds have been recorded as LSRs.

Source: Storm Prediction Center in Norman, OK

Nebraska also recorded an impressive 25 confirmed tornado tracks as well. I can't find history for Nebraska, but I'd imagine it is up there as well. It was the most tornado warnings issued in a single day in the state since June 2008 for a 24 hour period. Another really impressive aspect of this event is the number of EF2 tornadoes which stands total at 23 and several of which tracked through Wisconsin and even Minnesota (I believe this is a first for MN to record any tornado in December let alone a significant tornado). Very unusual and impressive event. Locally I recorded a 68 mph wind gust when the line pushed through and then an impressive long duration of gradient winds which lasted for several hours.

This would be an impressive event for June or July....nevermind just 10 days before Christmas. I should note we are up to 59 confirmed tornado tracks total for the entire event across the Plains and Midwest. The outbreak on 12/10/21 produced 62 confirmed tornado tracks which made it the largest December outbreak on record, so this (numbers wise) comes in closely behind that and just a few days later as well. Even more impressive. Although the intensity of many of the tornadoes fell short of the 12/10 event.
 
But was it a derecho? Derechoes have the highest reflectivities packed into the leading edge of the line of thunderstorms with a very tight gradient. That wasn't the case at all Wednesday.

Comments?
 
But was it a derecho? Derechoes have the highest reflectivities packed into the leading edge of the line of thunderstorms with a very tight gradient. That wasn't the case at all Wednesday.

Comments?
Yes it was a derecho, It meets all the criteria of exceeding 250 miles with continuous reports of 58+ mph winds or thunderstorm wind damage, and numerous reports of 65 knot wind gusts. A rather high end derecho too. Just a serial derecho event, which are more common with winter-time mid-latitude cyclones versus progressive derecho events which are more common in the spring and summer. This map and comment is courtesy Liz Leitman of The Storm Prediction Center in Norman, OK off Twitter:

267841944_939159716702595_4213559421238958155_n.jpg

It should be noted, there is no criteria by which one automatically deems an event a derecho other than the criteria that is listed on the SPC web page to sort out lower end events. Numerous SPC mets have referred to this event as a derecho, even as soon as real time on the 01z outlook on 12/15/21 as shown below. It traveled nearly 700 miles at an average speed over 65 mph.

Screen Shot 2021-12-19 at 3.45.42 PM.png

IMG_1132.JPG

The last image is courtesy of Jack Sillin off Twitter of the highest reflectivity of this serial derecho event as it tracked from Northwest Kansas to Northern Wisconsin.

I don't think there should be any argument over whether this event qualifies or not, it's among the higher end derecho events we have seen of recent in my opinion. If we had the tree foliage we had on August 10, 2020, the impacts across Nebraska, Kansas, and Iowa would have likely been far worse than they did on 12/15.

Note: None of the above images are mine, the credit should go their creators and original posters as I cited above. Thanks!

Another side note: Cool season derecho events with high shear and low CAPE (similar to 12/15/21) don't usually have extremely high reflectivity values compared to warm season progressive derecho events.
 

Attachments

  • 267841944_939159716702595_4213559421238958155_n.jpg
    267841944_939159716702595_4213559421238958155_n.jpg
    261.2 KB · Views: 0
From what I can find looking at the latest damage surveys, a total of 71 tornadoes have been confirmed from the December 15th derecho and tornado outbreak event in the Plains/Midwest. A total of 63 65+ knot wind reports were also logged by the Storm Prediction Center as well. The 71 tornadoes makes this the largest December tornado outbreak on record just ahead of the previous record set on 12/10/21 (5 days earlier) of 68 total tornadoes. I'm sure this will continue to change as surveys are done and high resolution satellite imagery used to identify the more obscure QLCS tornado tracks that may have been missed in real time damage surveys. Here is what I could find so far, note the total will add up to 72 as one tornado did cross from MN into WI.

Nebraska: 27 confirmed tornado tracks (I couldn't find history on Nebraska's largest outbreaks yet, so if anyone has that information, I would love to see where this stands).

Iowa: 24 confirmed tornado tracks (tying the 4th largest outbreak in the state's records on June 11, 2004 with 24 tornadoes).

Minnesota: 15 confirmed tornado tracks (largest December tornado outbreak ever and first significant December tornadoes of EF2 or greater)

Wisconsin: 6 confirmed tornado tracks (one of which was a bi-state tornado from MN to WI). Several EF2 tornadoes, of which were the first significant tornadoes also in December.

I'm sure in the coming days and weeks before the final NCDC Storm Data publications, more tracks will be confirmed from both this outbreak and the previous tornado outbreak on 12/10. It is fairly crazy to think about the fact that more tornadoes occurred in December 2021 than all of April 2021 (80 confirmed tornadoes versus 150 so far in December, woah). Even June 2021 featured less total tornadoes. I will have to do some research, but this may be the most active December for tornado activity since 2000, possibly further back.

Sources: NWS Omaha, Des Moines, Minneapolis, La Crosse, Hastings, Storm Prediction Center, and also used the GIS toolkit online as well for some of the tornado tracks.
 
Hey mods, I noticed someone has started an "Event" account for this date, do we want to merge these two threads together or keep them apart, there is only 2 posts so far in that particular thread, but since it doesn't say REPORTS, I figured any discussion pertaining to this event could be kept in one larger thread. That way it is easier to find for future use and purposes. Thanks!!
 
As of this morning, 31 tornado tracks have been confirmed in Iowa making it the 2nd largest tornado event in Iowa history behind a rather obscure event that occurred back on August 31, 2014 that I originally was not aware of. High resolution satellite imagery was used to confirm 35 tornadoes from that event embedded within an MCS that tracked across West Central Iowa several months after the fact (mostly all weak EF0-EF1).

The only other event I could find that rivaled this event was April 11, 2001 which produced 28 (3rd place now) tornadoes across the state as part of a high risk outbreak. The day before a billion dollar hailstorm tracked across MO and impacted parts of St Louis metro area!
 
I found it interesting how the tornadoes in IA seemed to be favored along the portion of the QLCS convection that was aligned more NW-SE rather than N-S, as most of the QLCS in Iowa was aligned. The 0-1 km shear and 0-2 km storm-relative flows were ideally aligned in both places, but I would have thought the orthogonality between the front of the line and the shear would have favored more tornadoes to the south and east of where the main corridor was (thinking Des Moines and points south towards the IA/MO border):

Based on the Three Ingredients Method used by (hopefully) all NWS warning meteorologists when warning on QLCS storm modes, the 0-3 km shear vector and its orientation to the updraft downdraft convergence zone (UDCZ) is used. Minimum magnitude of the vector is generally 30 kts perpendicular to the UDCZ, and the greater the magnitude, the more wiggle room you have in how perpendicular the vector needs to be for mesovortex formation and intensification. It looks like the 0-3 km shear vector through much of IA during the evening was oriented southwest to northeast at 50-75 kts (SPC mesoanalysis at 00z below), favoring mesovortex development on the portion of the line that oriented itself roughly northwest to southeast. Though, with that much 0-3 km shear, you'd have quite a bit of wiggle room, so portions of the line not oriented perfectly still would have had some potential. I've just glanced at MRMS data for general look at radar, and would have to look closer at the WSR-88D data to determine if this was the case.
1640210061040.png

But was it a derecho? Derechoes have the highest reflectivities packed into the leading edge of the line of thunderstorms with a very tight gradient. That wasn't the case at all Wednesday.

Comments?

I think that is generally the case, but as far as I'm aware, studies that have sought to define and/or classify derechos through features on radar have focused on identifying larger-scale features such as rear inflow jet, bow echo/surge, and book-end vortex. One of the more recent studies (Corfidi et al. 2016) proposed using features on radar as a defining factor of what makes a derecho a derecho, but concludes that the placement and resolution of WSR-88Ds prevents a uniform sampling of these types of events through their life span, making using radar for defining derechos questionable at the moment. While they did not mention the tightness of the reflectivity gradient, I feel the same logic can be applied.
 
Based on the Three Ingredients Method used by (hopefully) all NWS warning meteorologists when warning on QLCS storm modes, the 0-3 km shear vector and its orientation to the updraft downdraft convergence zone (UDCZ) is used. Minimum magnitude of the vector is generally 30 kts perpendicular to the UDCZ, and the greater the magnitude, the more wiggle room you have in how perpendicular the vector needs to be for mesovortex formation and intensification. It looks like the 0-3 km shear vector through much of IA during the evening was oriented southwest to northeast at 50-75 kts (SPC mesoanalysis at 00z below), favoring mesovortex development on the portion of the line that oriented itself roughly northwest to southeast. Though, with that much 0-3 km shear, you'd have quite a bit of wiggle room, so portions of the line not oriented perfectly still would have had some potential. I've just glanced at MRMS data for general look at radar, and would have to look closer at the WSR-88D data to determine if this was the case.

I'm really rough on this stuff, so I apologize if I ask a dumb question or say something painfully obvious. But what is the reasoning for the 0-3 km shear vector alignment to be parallel to the convective line being preferable for mesovortex formation? Is it more based on RKW theory (for long-lived squall lines), or is it more about ingesting streamwise vorticity?

If it is the former, then I 100% see the correlation expressed in the plot you showed (imagining the reflectivity underlaid). But if it is the latter, then I'm confused, because the vorticity vector generated by that shear vector would be parallel to the convective line in that case, so I would presume the system would be ingesting mostly crosswise vorticity given it's motion vector.
 
I'm really rough on this stuff, so I apologize if I ask a dumb question or say something painfully obvious. But what is the reasoning for the 0-3 km shear vector alignment to be parallel to the convective line being preferable for mesovortex formation? Is it more based on RKW theory (for long-lived squall lines), or is it more about ingesting streamwise vorticity?

As far as I'm aware, there are several theories about the methods in which mesovorticies are produced in a cold pool/downdraft-driven system. But for the leading-edge tornadic mesovortices, yes, you could say it builds upon RKW theory in that you need the updraft and downdraft to be balanced to achieve maximum updraft strength to tilt and stretch the horizontal vorticity formed along the leading edge of the line. Schaumann and Przybylinski's 2012 SLS presentation (abstract and paper) provide more detail on the method and use of 0-3km shear vector, and there was recently a study from Justin Gibbs that evaluated the method.
 
It has taken me a while due to the holidays and various other distractions, but I have now completed a writeup on this exceptional storm system. It has a little more emphasis on what happened in New Mexico and Colorado than some others I have seen, but does try to cover the whole thing with a few graphics and a large number of Web links. You can access it at:

www.johnefarley.com/storm121521.html
 
Back
Top